|
Perspective
By Rich Checkan
The official end of summer comes with the autumn equinox. This year, that falls on September 23rd.
Of course, the unofficial end of summer is Labor Day weekend. It is now in our rearview mirror.
Children are back in school. Vacations, for the most part, are complete. Full focus turns to work and to the markets.
Historically, this is the start of gold’s annual time to shine.
Converging Forces
September through February is usually when gold sees its high prices for the year. This is attributable to the aforementioned renewed focus on work and markets following the summer where surf and sand are typically the focus.
But there’s more to it. Jewelers are buying gold in the fall for the wedding season as well as for the end of year holidays. They tend to buy now so they can make the jewelry they hope to be selling for these various holidays and events.
But this year, there are more forces starting to build pressure on the gold price…
- Bond yields
- Labor market
- Wage inflation
- Anemic dollar
- Dovish hawks
- And…
The 10-year treasury recently hit its highest yield since 2007. The 30-year bond hit its highest yield since 2011. These peaking yields have clearly syphoned some investment dollars away from gold. This is one area to keep an eye on going forward.
After a slight decline, the next step for bond yields could be quite helpful for gold’s price appreciation. If bond yields have peaked, the luster of gold should come back fairly quickly.
Of course, that would suggest the Federal Reserve at least paused rate increases. And, at least for the September Federal Open Market Committee (FOMC) meeting, that is the consensus among analysts.
Cracks are starting to form in the labor market… one of the key areas the Federal Reserve considers when deciding to raise rates or not. Although payrolls jobs numbers are increasing, they are rising slower than anticipated. Worse yet, previous months’ figures are all suffering downward revisions after the fact.
On top of that, the unemployment rate is rising. Mix in the fact that wages aren’t inflating to keep up with the costs of goods and services, and we can very well be on the verge of a recession.
Personally, I believe we are on that precipice. The strain on consumers has been evident for quite some time. The recent reports about consumer credit card debt topping $1 trillion are confirmation to me that consumers have replaced cash-out home refinancing with credit cards in order to make ends meet.
This will put even further strain on our consumer driven – and dependent – economy.
Amidst it all, the dollar has fallen from dominance a year ago at 116 on the U.S. Dollar Index to right around 104. That’s a significant fall from grace.
Finally, despite the fact that he wanted to talk tough at the Jackson Hole meeting, Chairman Jerome Powell’s hawkish comments were delivered so meekly the markets clearly do not believe him.
AND… Central Banks
Even though there have been serious headwinds to gold price appreciation all through the summer doldrums, gold’s price held firm in range.
There is only one reason… because it is not a result of retail buying. The retail customer has largely been watching from the sidelines since the all-clear signal was given regarding the banking crisis in the first quarter.
Personally, I don’t think banks are all clear… especially with the ticking time bomb known as commercial real estate default lurking in the shadows. But consumers clearly felt all was clear and it was safe to get back in the water.
The gold buying that has supported the gold price for the past year or so has come from central banks. They set records in 2022. They surpassed last year’s pace in the first quarter. They have slowed their buying a little since then, but the central banks are far from done.
This backstop is what has kept gold trading in range despite weakness from retail buyers. It is what has kept gold steadily sailing into a headwind.
What’s Next?
Good question. I won’t pretend to know the answer.
However, I would expect central bank buying to continue given the instability of a world that is polarizing.
That should provide sufficient support to the gold price as retail investors come back into the market in this traditionally strong period from September through February.
Sprinkle in peaking bond yields, a pause in interest rate hikes, labor market weakness, wage stagnation, debt concerns (at every level), and the potential for recession and default (at various levels), and I think you have a recipe for higher gold prices.
The good news is I don’t see this happening overnight. But the trend has been building for some time. So, don’t delay further. Take care of your allocations now… for gold as wealth insurance… and for silver for profit motive.
In the end, I honestly believe you cannot go wrong here. After all, Congress shows no sign of becoming fiscally responsible. Deficits are predicted to grow at a rate of $5 billion per day. Our debt is expected to exceed $50 trillion by 2033.
The only response from our government will be to expand the money supply… inflate the currency… make each and every dollar worth less.
If you want to Keep What’s Yours, start converting dollars to gold and silver now.
Call us at 800-831-0007 or send us an email today so we can help you get your precious metals allocation in order.
—Rich Checkan
Editor's Note: Dr. Mihai Macovei is an associated researcher at the Mises Institute. This article was originally published on September 1, 2023.
Feature
There Is No Fed Magic Trick to Achieve a Soft Landing
By The Mises Institute
 Economic growth in the United States accelerated to a 2.4 percent annualized rate in the second quarter of 2023, picking up from 2.0 percent in the first quarter, and climbing well above the 1.8 percent rate predicted by economists. Many analysts are surprised that the US economy has continued to expand at a robust pace despite the Federal Reserve’s (Fed) aggressive tightening on monetary policy. Economic growth in the United States accelerated to a 2.4 percent annualized rate in the second quarter of 2023, picking up from 2.0 percent in the first quarter, and climbing well above the 1.8 percent rate predicted by economists. Many analysts are surprised that the US economy has continued to expand at a robust pace despite the Federal Reserve’s (Fed) aggressive tightening on monetary policy.
The Fed raised interest rates by more than 500 basis points (bps) since March 2022. And yet, the labor market remains tight with a very low unemployment rate at 3.6 percent while the Standard and Poor 500 stock index is up almost 20.0 percent since the beginning of the year. Economists are optimistic that the Fed could deliver a soft landing by reducing inflation close to the 2.0 percent target while avoiding a recession. But will the Fed’s magic really work?
Insufficient Monetary Tightening
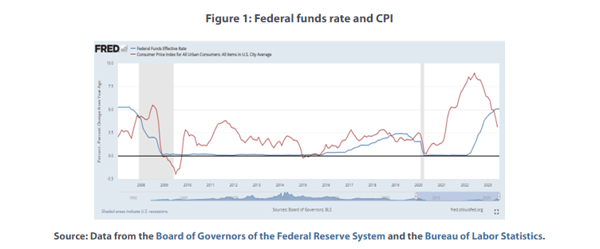
Since the financial crisis of 2008, the Fed had followed an “easy money” policy, but during the pandemic, the Fed leaned even further into this stance. As Consumer Price Index (CPI) inflation accelerated toward 5.0 percent, Fed Chair Jerome Powell belatedly admitted that inflation wasn’t transitory and shifted course. In March 2022, the Fed started raising interest rates but could not prevent inflation from surging to a peak of 9.1 percent in June 2022.
In 2022, it became apparent that the Fed’s tightening on monetary policy was not hawkish enough and that it was more concerned with avoiding a recession and instability of the financial sector. The interest rate hikes were piecemeal, and largely insufficient, as the real interest rate (the difference between the federal funds rate and the inflation rate) remained negative until April 2023 (figure 1).
The current positive real interest rate of about 2.0 percent is still rather low by historical standards and likely continues to artificially stimulate growth. Headline CPI inflation, helped by declining energy prices, may have decelerated to 3.1 percent in June but remains above the Fed’s 2.0 percent target. Moreover, core inflation—which excludes volatile food and energy prices—was at a sticky 4.8 percent in June as wage increases sustained strong consumer spending and second-round inflationary effects.
Most important, the Fed cannot rely only on interest rate hikes to tighten monetary policy. It needs to also shrink its balance sheet via quantitative tightening (QT) to reverse its previous quantitative easing, a policy of massive purchases of Treasury and mortgage-backed securities to boost commercial banks’ reserves and liquidity while lowering longer-term interest rates. Quantitative easing made the Fed’s balance sheet explode to a whopping $9 trillion, as of May 2022 (figure 2), and analysts agree that by reducing bank reserves, QT should exert upward pressure on interest rates while curtailing lending.
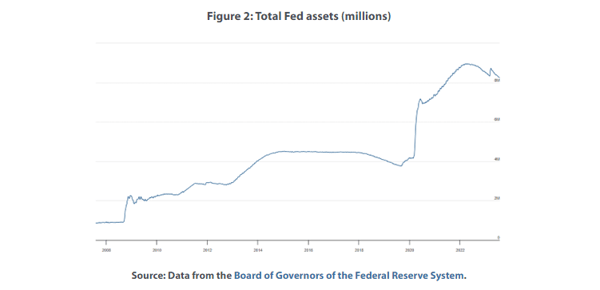
In June 2022, the Fed started implementing its QT policy by shedding its holdings of US Treasuries and mortgaged-backed securities at a rate of $95 billion per month. But this process was undermined by the need to provide liquidity to the banking sector after banks, such as the Silicon Valley Bank, experienced hefty deposit runs. As a result, the Fed’s balance sheet declined by around $600 billion (or about 8.0 percent) from its peak to about $8.3 trillion by the end of July 2023, although the volume of held securities outright dropped by about $900 billion over the same period.
Still Abundant Bank Reserves
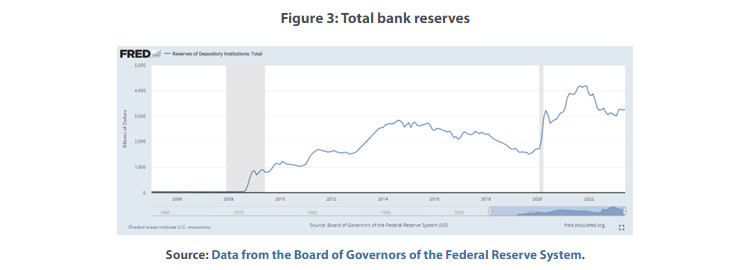
Some analysts claim that the Fed can use QT while also providing additional liquidity to select banks in distress (i.e., have its cake and eat it too). This is obviously not true. The main purpose of QT is to withdraw bank reserves via asset sales to reduce the banks’ lending capacity. But what we see is that bank reserves remained at historically high levels (figure 3) despite the Fed’s attempts at monetary tightening. Since the Fed’s Board of Governors reduced reserve requirement ratios on net transaction accounts to 0.0 percent as of March 2020, these reserves are de facto excess reserves on top of which banks can multiply credit. This means that banks still have ample room to lend even if the Fed has hiked the federal funds rate, which may also explain the uneven rise of loan interest rates and resilience of credit activity.
Impact on Interest Rates and Credit
Market interest rates went up since the Fed started its monetary tightening (but not proportionally), reflecting lending maturities and other credit market specificities. The Fed hiked the federal funds rate by 525 bps between March 2022 and July 2023. The bank prime loan rate, which is one of several base rates used by banks to price short-term business loans, mirrored the increase in the Fed’s key rate almost one to one (figure 4).
On the other hand, although longer-term ten-year US Treasury yields rose above 4.0 percent, they went up by less than 200 bps over the same period. The same goes for other bank loan interest rates such as five-year car loans (which went up on average by 330 bps until May 2023), two-year personal loans (which increased by 210 bps), and fifteen- and thirty-year fixed mortgage rates (which rose by close to 300 bps).
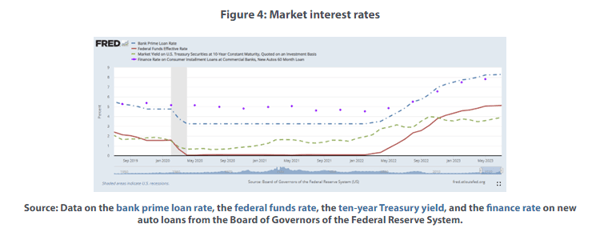
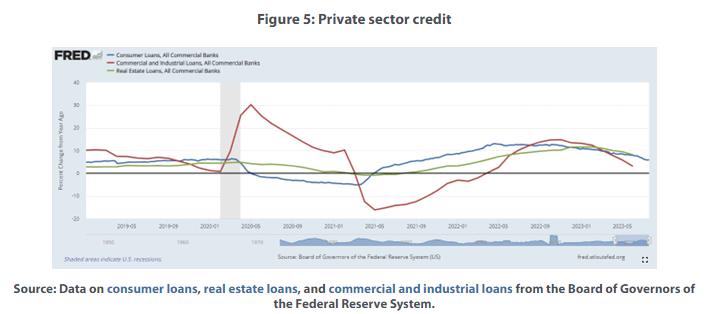
This shows that a majority of large and well-capitalized US banks increased loan interest rates much less than the Fed while also paying close to zero interest rates on bank deposits. They can afford it because they have plenty of reserves and liquidity, which the Fed did not mop up, and they continue to lend to the economy. Although the annual growth in total bank credit decelerated from close to 7.0 percent in 2022 to −0.9 percent in the second quarter of 2023, it was primarily driven by the decline in credit to the government, or investment in Treasury securities. At the same time, consumer and real estate loans grew annually by more than 6.0 percent and 5.0 percent respectively in the second quarter of 2023, while commercial and industrial loans recorded a small dip and remained flat in the first half of 2023 (figure 5). As lending to the private sector remained positive, it is unsurprising that economic output also continued to expand.
Conclusion
The Fed’s magic trick to achieve a soft landing while aggressively tackling inflation is only smoke and mirrors. The Fed’s piecemeal interest rate hikes were not only insufficient to slow the economy down, but they also received very little support from quantitative tightening (i.e., the withdrawal of the liquidity that was previously injected into the system). Left with plenty of reserves, banks helped the economy to grow by continuing to lend while also refraining from increasing lending rates as much as the Fed. As a result, taming inflation is not yet a done deal, as core inflation remains sticky and well above the Fed’s target.
The money supply shrinkage signals economic trouble ahead when the monetary overhang is likely to be worked out in earnest. The Fed’s dovishness has just pushed forward a day of reckoning. Moreover, a steady deterioration of fiscal deficits alongside Gargantuan public projects to boost domestic demand and spur high-tech green infrastructure investment magnify recession risks as the Fed may be forced to further tighten to reduce inflation pressures. Fitch’s recent downgrade of the US’s long-term credit rating over rising public debt and deterioration of governance is just another confirmation that macroeconomic policies have been unsound for too long.
Editor's Note: Omar Ayales is the Senior Trading Strategist & Editor at GCRU (Gold Charts R Us). If you have any questions, you can reach him at oayales@adenforecast.com or visit www.goldchartsrus.net.
Hard Stuff
Gold: Investor's Haven of Choice
By Omar Ayales
Concerns over the higher path of inflation for longer are on the rise yet they´re well placed. Monetary authorities have kept hawkish tones to keep inflation expectations down but more and more it’s becoming evident higher inflation for longer is here to stay.
Consider ongoing economic sluggishness out of China is putting downside pressure on commodities as demand continues to disappoint. It’s helping push consumer prices (and inflation) down across the globe. The slack is allowing the high rolling economies of the U.S., Europe, and Japan, as well as many other emerging economies such as in Latin America and India, the fuel to run hotter for longer.
It’s giving monetary authorities in the U.S. something to think about as policy moderates with consumer prices scaling back, even though the local economy remains running red hot by certain metrics. Labor markets in Europe, Japan and the U.S. remain strong within historic standards. In the U.S., wage inflation has surpassed consumer inflation thus far, minimizing inflation’s eroding effects.
Over in Europe, the cost of shipping gas to keep the lights on has held regular or has even declined over the past year in large part given slack in demand from China, thereby minimizing the cost effect of having to source gas outside of Russia. A policy NATO allied countries have embraced since the invasion of Ukraine. Consider only a year ago, concerns over Europe’s ability to have access to power were at a high.
Japan has been booming on its own after years of slack… Emerging markets, particularly those with strong ties to the U.S., Europe and Japan are also thriving.
Supply chains have somewhat stabilized, so have prices over the past year; however, upward pressure remains given growth and strength predominantly out of the U.S., Europe, Japan and certain emerging economies.
However, more recent price action, particularly within precious metals, resources and energy suggest global demand is tightening. It could be suggesting that we might have seen the lows for now. It could be telling us global demand is on the rise…
Crude oil is breaking above a key resistance that has been the top side of a consolidation band all year long. The breakout is bullish for crude oil, suggesting higher lows are likely moving forward. Crude oil’s next key resistance is at $92.
 Similar has happened with copper as it remains up trending, approaching a key resistance of its own near $4. If copper now confirms crude oil’s recent break-out up move, it’ll be a sign that global demand for resources and energy continues to tighten, pushing prices of these resources (and most everything else) up. Similar has happened with copper as it remains up trending, approaching a key resistance of its own near $4. If copper now confirms crude oil’s recent break-out up move, it’ll be a sign that global demand for resources and energy continues to tighten, pushing prices of these resources (and most everything else) up.
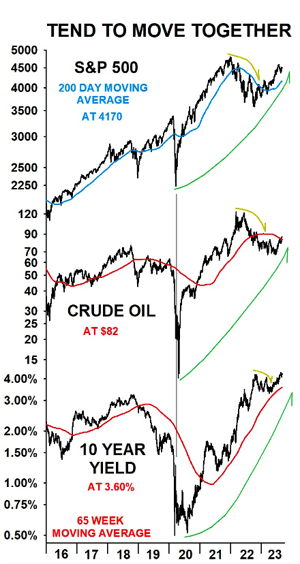
The recent breakout in long term U.S. treasury yields is also indicative of higher inflation for longer since rising rates tend to coincide with rises in crude oil and stocks.
Notice this first chart (CHART A) shows the 10-year yield, the S&P 500 and crude oil lined up since 2016. It shows all three asset classes tend to move together. Notice all three rose from the lows in 2016 to a peak in 2018; they all then proceeded to decline until reaching the 2020 lows (Covid-19). Since then, all three have risen, peaked, pulled back and have started to rise again. Crude oil was the last one to confirm strength with more upside potential.
The up move in all three asset classes confirms the overall direction for stocks, rates and commodities is to the upside.
Moreover, the up move in resources and energy could be telling us the increased demand could be coming from China and the economies that benefit from China’s economic recovery. It could be that lows for the Chinese economy are in and the recent uptick in global demand is a reaction to China’s announced stimulus measures.
 If the red giant wakes up and goes back to a growth trend like past performance, it could put pressure on supply chains pushing prices (and inflation) up. If the red giant wakes up and goes back to a growth trend like past performance, it could put pressure on supply chains pushing prices (and inflation) up.
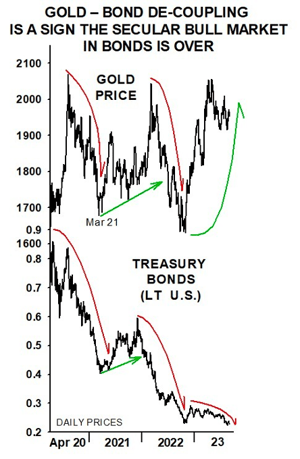
Although the higher inflation for longer narrative is currently gaining more steam, it was first confirmed last year when gold decoupled from U.S. treasuries.
As you know, gold and long-term U.S. treasuries have been rising together since early 2000s, over 20 years. However, back in 2022 when long term U.S. treasuries broke down, gold held its own and bounced up stronger.
This next chart (CHART B) shows gold and long-term U.S. treasuries since the 2020 lows. It shows how gold and treasuries started moving together, as they had been for the past 20+ years.
Notice on the chart they both fell from recent highs in 2020; they both then bounced up (gold to re-test the highs, stronger than bonds) and fell back, below the Mar/Apr 2021 lows. Gold, conversely, held and yet again bounced back up, reaching once again the highs. Treasuries kept falling in 2023 to new lows, severing a 20+ year relationship.
The dynamic confirms the mega shift in long term rates… meaning the deflationary era of the past 40+ years is over, and a new era dictated by higher inflation for longer is underway and here to stay for possibly decades to come. It also confirms gold as investor’s choice for safe haven during this new era of persistent inflation.
Editor's Note: Nomi Prins is a best-selling author, financial journalist, and former global investment banker. At Rogue Economics, Nomi shines a light on the collusion that happens between Wall Street and Big Government behind closed doors, and she provides actionable steps for readers to protect and grow their wealth.
The Inside Story
The Fed Is Operating at a Loss
By Nomi Prins
This week, we have questions on the soundness of the Fed’s book… what it means for the market and the banks… as well as what’s next for gold in the new digital dollar era…
I was curious with the quantitative tightening (QT) happening now that the Fed will likely take losses in reducing these securities from its balance sheet.
How will these losses be shared, and do they have any impact on the owners of the Fed in terms of sharing those losses?
Also, what are the potential effects of this on the stock market and, in particular, the banking sector?
– Keith B.
Keith, thanks so much for your questions. They bring out the “wonk” in me. Let me explain…
First, the Fed is already operating at a loss from reductions in its balance sheet. And it’s one that has been growing since September 8, 2022.
In fact, the last time the Fed reported a slight gain was in its September 1, 2022 H4.1 report.
The Fed releases its H4.1 report every Thursday. Most people pay no attention to it. I do. (Catch up on my previous essays on this here and here.)
And I can tell you that, on July 27, 2023, the Fed was showing a loss of about $82.7 billion.
Now, the Fed doesn’t go about discussing its losses at its FOMC meetings or the Q&A with Fed Chairman Jerome Powell that follows them. And no reporter asks.
Plus, you need a magnifying glass to even find this loss on the H4.1 report.
For those of you that want to see for yourselves, click here to open the Fed’s H4.1 report from July 27, 2023.
At the left of the top line of numbers, you can see the Fed holds $8.2 trillion in a category called Reserve Bank Credit…
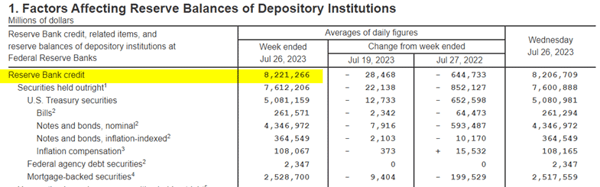
In layman’s terms, that’s the amount of money the Fed has printed and given to banks in return for Treasuries and other bonds via quantitative easing (QE).
To be clear, the Fed is not selling bonds. It’s merely not buying new ones to replace the ones that are maturing.
And before the Fed began raising rates last March, which was several months before it started this mild version of QT, the size of its book hit a record high near $9 trillion.
So at this point, the Fed has only “QT’d” about 9% of its entire balance sheet. That’s not a big deal. And this is by design.
The Fed doesn’t want to fire-sell a large chunk of the bonds it’s holding, and the banks don’t want to give the Fed its money back.
THAT could create a bond market and bank collapse.
Now, if you keep scrolling down at that link above, you’ll reach item box 6: Statement of Conditions. In that box, the line that says “Earnings remittances due to the U.S. Treasury” is the key…
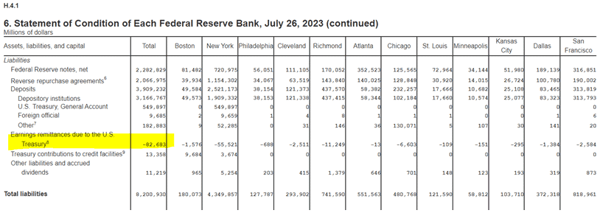
In its first column, there’s that $82.7 billion number I mentioned earlier. And there’s a tiny superscript eight there.
If you scroll down to see what eight means, you’ll see four lines of accounting jargon:

In plain English, it says that the Fed remits excess money to the Treasury from its operations each week, if it has any excess money. If it doesn’t, the Fed is operating at a loss.
Today, the Fed is operating at a loss.
It’s not making enough money to pay the Treasury anything. That’s because the value of its U.S. Treasuries is lower (and the rates higher) than the Treasuries that are maturing.
Now, because it’s the Fed, no one cares.
The Treasury knows the Fed can print money whenever it feels like it to cover payments, anyway. And no one is going to charge the Fed late fees on the money it’s not paying the Treasury, either.
Yet, because of the Fed’s tightening policy, the amount of interest the government must pay on the money it borrows in the form of Treasury bonds has increased. The value of those Treasuries has gone down in tandem.
We’ve explained this inverse relationship before.
So the nation is operating on record debt and a deficit, and the Fed is operating at a growing loss.
Which takes me back to the rest of your questions.
I can assure you that the banks aren’t sharing the Fed’s losses. They aren’t obligated to remit money to the government like the Fed is – except in the form of taxes. But that’s a whole other story.
In terms of how this effects the stock market – it doesn’t.
As I mentioned, the Fed’s been operating at a loss for nearly a year. The stock market has been rallying much of that time, save last fall.
And then, it was more worried about when the Fed would pause its rate hikes than whether the Fed was losing money because of its own polices.
Now, I can’t give personalized advice. But what I’ll say to all my readers is this:
Step 1 – Ignore what’s happening with the Fed’s QT process. It’s slow and has a marginal impact, if any, on the market.
Step 2 – Diversify your portfolio into hard assets like gold. Sprinkle in a finite asset such as Bitcoin. And select commodities and stocks in sectors that provide real, lasting-use value – such as in the energy sector.
What happens to the digital dollars if the electrical system is attacked, or the country suffers a natural disaster and/or an enemy attack?
– Robert B.
Hi, Robert, that’s a great question. And it’s the reason why the Fed and the government as a whole is so focused on cybercrime protection. We really are vulnerable without trying to stay ahead of cybercriminals.
Now, of course, if the entire power grid was down because of a natural disaster, you couldn’t get your money out of any electronic mechanism or log in to your bank account.
That’s whether there’s a prevailing digital dollar, or we’re still using ATMs to extract cash or apps to transfer money like Square or Venmo.
That said, all of the digital dollar information would remain in the cloud. It wouldn’t disappear. It would just be hard to get to.
But this brings up a good point for anyone about protecting their financial liquidity in an emergency.
Worse comes to worst (and I mean really bad!), one could use a pawn shop and, in a pinch, convert one’s gold to cash. (Although, I can only imagine how heinous the fees might be in this scenario.)
In my opinion, even if the centralized banking and Federal Reserve system converts to a digital dollar, there will be those of us who keep cash on the sides – just in case.
And as such, we will be able to transact with each other.
That’s why, in general, it’s prudent to diversify one’s portfolio of assets that can act as currency in a pinch. And it’s why keeping physical gold is one big part of that – as well as cash.
I’ll leave you with a story from my own life…
A few years back, my town was undergoing the Thomas Fire. There was no power – or Wi-Fi – for days.
Having cash on the side, as well as silver and gold coins, came very in handy. It made me feel more secure, even though I only needed to use the cash.
You say gold can be a good backup, but how would we be able to “spend” gold if everything goes CBDC? How do we/can we even trade it, especially if they “cancel” paper money, which seems to be a possibility?
– Bob O.
Hi, Bob. Thanks for your questions!
While it’s true that CBDCs may change the way we transact, gold’s value doesn’t depend on its day-to-day use as currency. Gold has served as a store of value and a hedge against economic uncertainties for centuries.
So, for anyone who has gold, the best thing to do is hold onto it. As long as it’s possible to buy and sell gold at prices set by the market and not by the Fed, it will have value.
Think about it this way…
We can compare the arrival of CBDCs to the debut of paper dollars or fiat Federal Reserve notes (like your dollar bill).
Back in the day, your dollar bill had a connection to gold, but that link vanished in 1971.
Now, just because people transact with these bills doesn’t mean the value of gold has fallen. To the contrary, it has risen. In 1971, the price of gold was $42 per ounce. Now, it’s over $2,000 per ounce.
I believe that will remain the case. That’s even if everyone converts their money to CBDCs. That’s because you can’t fabricate gold, and you can’t create its history out of thin air, either.
And that’s why gold investors won’t be swept away just because there’s a new method of exchange.
Remember, CBDCs will still be fiat currency. They are created by government policy and backed by confidence – or lack thereof – in the government. They are just in a new form of fiat.
As for “paper money being canceled,” I think we have to be mindful of the fact there’s a lot of uncertainty surrounding CBDCs.
Despite the recent launch of FedNow, it’s still not “official” in the U.S. And other countries that are implementing CBDCs have different approaches, making it hard to predict what could happen in the future.
Don’t get me wrong, the shift away from cash is already in motion, and it’s real. (I did a deep dive on this in a video presentation I released recently. Watch it here.)
But on a bigger scale, the transition will take some time. So, for the foreseeable future, I still see cash (and checks) sticking around, being used side by side with electronic payment methods.
But if you’re worried about the government outright banning gold transactions with CBDCs, I don’t think that’s likely to occur.
First, a move like that would require a major bipartisan regulatory overhaul of our financial system. And I just don’t see it happening.
And if government officials try to take action on gold, they will likely face legal challenges based on constitutional rights, human rights, or regulatory grounds.
What about outright confiscation?
Well, that’s a totally different ball game. To be honest, there’s nothing stopping the government from trying to take away gold through an act of Congress or an executive order. They’d need a compelling reason, but in theory, it’s possible.
As my fellow history buffs will know, we’ve been down this road before in the U.S. In 1933, President Franklin Delano Roosevelt issued an executive order, forcing Americans to hand over their gold or face a $10,000 penalty.
The idea behind this was that “hoarding” gold during the Great Depression was stalling economic growth.
But you can’t make that argument today, since we don’t live under the gold standard anymore.
There’s no direct connection anymore between gold and the printing of our currency (physical or digital). So it’s much less likely that the government or president can connect a national emergency and gold confiscations to fund the government (like they did during the Great Depression.)
Even so, if you’re concerned about spending or trading physical gold during crises, there are smaller sizes available for purchase. They range from 1 gram to 10 ounces.
A 1 oz. gold bar currently costs about $2,000, and 1 gram goes for about $50. These smaller denominations make it more convenient for everyday use.
You can also buy gold coins, which are also easier to use in exchange for items or services in times of crisis. For more on buying accredited and secure gold coins, check out my previous essay about the Perth Mint Program.
Just keep in mind, coins and other forms of physical gold are typically priced at a premium to the gold spot price.
While we’re on the topic… it’s worth knowing that you can also hold bars and coins in vaults outside the country. Countries considered good places to store gold include Singapore, Switzerland, New Zealand, and Germany.
As a U.S. citizen, you’d have to declare to the IRS that you have gold in a foreign country. We can’t give tax advice here, so you would have to check on these details with your accountant or tax lawyer.
Finally, you can also buy a gold exchange-traded fund (ETF) that is backed by physical gold. Gold ETFs offer the advantage of holding gold without the hassle of storing, securing, or transporting it. (I covered this in more detail in the April 7 mailbag.)
Then, keep your gold safe. Use it when and if you need to. And don’t worry about what everyone else is doing.
|