|
Perspective
By Rich Checkan
We have seen a few records over the past two months…
In April, gold hit an all-time high in U.S. dollar terms of $2,431.55.
In May, we have two records for the Dow Jones Industrial Average (DJIA). The Dow had its highest all-time closing price of $39,908.00 on May 15th. The next day, the Dow had its highest all-time intraday price of $40,051.05.
Judging from the coverage in the mainstream press, you would think the Dow’s records were the most impressive watermarks reached.
You would be wrong.
Ratios That Do Not Matter
The pundits are all beside themselves with record highs in the Dow as measured with U.S. dollars.
I am not.
Look around. Everything priced in U.S. dollars costs more.
Of course, that is much less a function of any particular item going up in value. Rather, it is a clear and distinct function of the U.S. dollar falling in value.
As a result, it takes more dollars to buy everything… the stocks that make up the DJIA, a car, a home, eggs, gas, a college education, a home… and gold too for that matter.
Through fiscal mismanagement over many decades by both political parties, the U.S. dollar is worth but a fraction of what it used to be worth. The current thinking is the dollar has lost 98% of its purchasing power since the creation of the Federal Reserve in 1913. That means ninety-eight cents of your purchasing power from every dollar you own is gone.
So, when you give someone a U.S. dollar these days, just remember you are giving them your “two cents.”
And… as a result, the U.S. dollar – or any mismanaged fiat currency for that matter – is a horrible measuring stick of worth or value.
In other words, the ratio of U.S. dollars to pretty much any good or service is a flawed and worthless ratio. A price in dollars tells us nothing about the value of that good or service.

Measuring Sticks
Given all the euphoria over the Dow’s new U.S. dollar high, it seems it is high time for a discussion of measuring sticks. I have talked about this on and off over the years… at conferences and in this newsletter.
Consider you have a six-foot table in front of you and a twelve-inch ruler in your hands…
If you measure the length of the table, it will take six lengths of the ruler to come up with the measurement of six feet.
Now, consider you cut one inch off the end of your twelve-inch ruler…
When you measure the length of the table again, you find the table is six and a half ruler lengths long.
Does that mean your table is six and one-half feet long? Did your table grow in length?
Of course it didn’t!
Instead, you must look at your measuring stick. Since your measuring stick was shortened by one inch, the length of your table was inflated by one inch for every foot you measured.
If you understand this concept, you understand the problem with measuring value or worth with U.S. dollars which are constantly losing value.
Any measuring device must remain constant in order to render meaningful measurements over time. It does not matter if we are looking to measure time, length, weight, or value. If your measuring device is not constant, it is a worthless “measuring stick.”
In the case of the U.S. dollar, it is a “worth less measuring stick.”
Ratios That Do Matter
If you want the most accurate measurements, you need the most accurate instruments available to take the measurements…
Time – atomic clock
Length – micrometer
Weight – electronic precision balances
Value – GOLD
For over 5,000 years now, nothing has held its value better than gold. Nothing is better than gold in preserving purchasing power.
So, if you want an accurate “measuring stick” to measure value or worth, gold is the natural and truly only logical choice.
Let us take a look again at the Dow. However, this time, instead of measuring the Dow in U.S. dollars, let us measure the Dow in terms of gold.

As you can plainly see, the recent all-time U.S. dollar record highs for the Dow are but a fraction of the all-time highs reached in the late 1990’s as a result of the Dot.com bubble.
If you wanted to buy all the stocks on the DJIA on August 31st, 1999, you would have needed 44.85 ounces of gold to do so. Earlier this week, it took roughly 16.36 ounces of gold to buy all the stocks on the Dow.
In gold terms, the DJIA is less than 36% of its value at the end of August twenty-five years ago.
This is what happens when you measure value with a “worth less” measuring stick like the U.S. dollar. Your sense of value or worth becomes completely distorted.
Measure value in gold – a commodity that has a proven track record of preserving purchasing power – and you will get a true feel for what anything and everything is worth.
Gold eliminates distortion. U.S. dollars foment distortion.
.png?width=600&height=300&name=goldsilverportfolio_600x300%20(1).png)
Dirt Cheap
If you understand what I have written above, you completely understand why I have said for the past several years that gold at all-time highs is dirt cheap. You will also understand why silver at forty percent of all-time highs is even cheaper.
And you will understand why I will continue to preach that gospel truth for many years to come.
Right now, the U.S. dollar is distorting value. The U.S. dollar is making it appear to the casual observer that the Dow is making new highs and gold is expensive.
Nothing could be further from the truth.
And… since the majority of investors are swallowing that narrative hook, line, and sinker… the mainstream Western investor is not buying into this rally in gold. That means premiums over the spot gold price for fabricated coins and bars remain at extremely low levels as well.
You have the dream combination right now of low prices and low premiums.
If you are not buying here, you are missing one of the best opportunities you will have to do so.
Find a way to buy here. Sell some over-priced stocks for a profit. Tap into your IRA funds. Pool funds within your family or an investment club.
Find the cash. Buy gold. Buy silver.
You will be kicking yourself later if you do not take action now. Buying gold and silver at U.S. dollar all-time highs right now is the best way I know to Keep What’s Yours!
Buy on our website directly… www.assetstrategies.com. Call us at 800-831-0007. Or, send us an email.
Do Not be fooled by distorted U.S. dollar values. Choose your measuring stick wisely. For measuring value, the only choice is gold!
—Rich Checkan
Editor's Note: Brien Lundin is the Publisher of Gold Newsletter and CEO of the New Orleans Investment Conference. You don't want to miss Brien, Rich, and many many more at the 50th Annual New Orleans Investment Conference on November 20-23, 2024. Register today!
Feature
Rougher Seas
By Brien Lundin
After a huge move in March and early April, the new gold bull market has become much more volatile. The good news is that, with two corrections and rebounds behind it, the price is setting higher highs and higher lows.
Gold has entered a roller-coaster phase in its bull market.
That’s normal, and in this case there are essentially two reasons for the new volatility in gold: The always-applicable “profit taking” excuse (which actually has some validity after gold’s big run), and the latest realization that the Fed isn’t about to start cutting rates.
Of course, as I’ve argued for some time, the Fed will be forced to pivot at some point. The level of debt built up over nearly five decades of ever-easier monetary policy is incompatible with interest rates at current levels.
The reality is that the longer the Fed waits to cut, the more urgently they’ll have to cut once they begin. Something is going to break if they wait much longer.
Still, there’s no arguing that investor expectations for a Fed rate cut this summer have shifted over the past few weeks to a most optimistic scenario of December, and most likely none at all this year.
That’s a huge shift from the five-to-six cuts that the market expected as of late last year. And that reset of investor expectations has been the primary cause of whatever weakness we’ve seen in gold.
But that highlights the most amazing aspect about what gold has done this year, and more specifically since the end of February.
If someone had told us in January that not only would we not see a half dozen rate cuts in 2024, but that we would likely see none at all this year, we would have expected gold to lose $200-$300.
Instead, we’ve seen it gain that much.
I don’t mean to be all sunshine and rainbows here, but we need to keep things in perspective through the current volatility. Consider this three-month gold price chart:
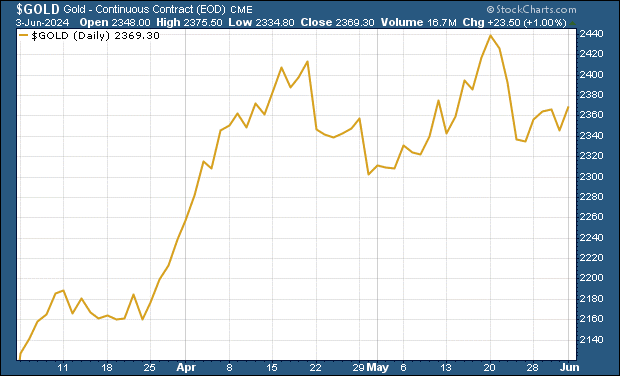
Gold’s two big sell-offs still look daunting, but we’ve rebounded from each of them. Importantly, the gold price has set higher highs and higher lows.
In other words, the bull market is firmly intact.
Which brings us to the last of our three charts, a one-year look at gold:
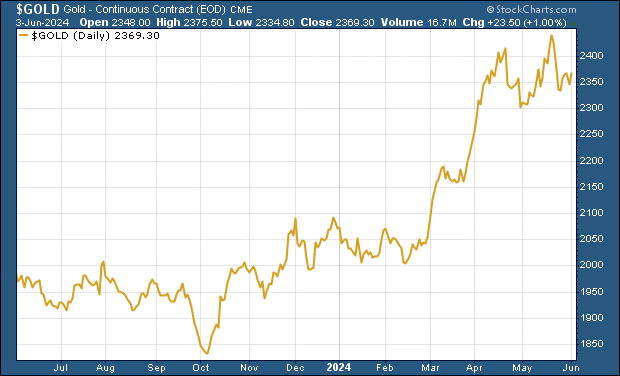
Again, context is everything. Viewed from this vantage point, it seems we should be ecstatic at how far we’ve come in this gold market...and how insignificant these corrections have been. In fact, they are precisely what we should expect and want to see for the longer-term health of the bull market.
So the trend is still our friend. And we should also take heart in what’s been driving this rally...although there have been some changes there as well.
The Beast In The East
There can be little doubt now that the gold price is being set in Asia, and specifically China.
Chinese demand, both from the Peoples Bank of China and domestic buyers, has been the biggest factor behind this new gold bull market.
The fact that gold on both the Shanghai Gold Exchange (the physical market) and the Shanghai Futures Exchange (cash-settled) continues to trade at a significant premium to Comex and other Western price benchmarks is one clear sign of who’s in charge.
Add in the fact that intra-session bear attacks on gold are being routinely reversed by massive, and mysterious, waves of buying, and it’s apparent that the Western bullion bankers have been on the back foot.
This pattern has given me confidence that even multi-session downtrends, like what we’ve been seeing recently, will eventually be turned back by renewed rallies.
Still, it’s fair to ask what the status of Chinese buying is right now.
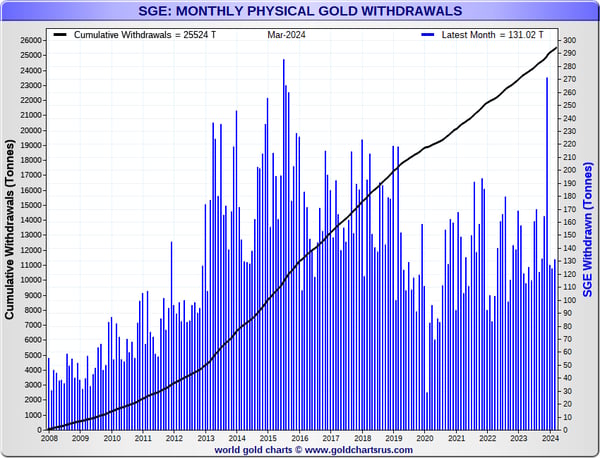
As you can see, the surge in Shanghai Gold Exchange withdrawals (which is the best proxy we have for domestic demand) surged to its second-highest level ever in January. Since then, the demand has dropped off a good bit, but still remains at elevated levels.
Consider this chart (again, from our friend Nick Laird at GoldChartsRUs.com):
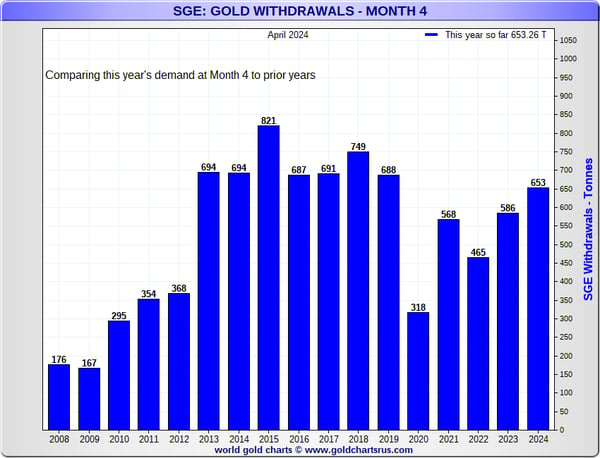
Thanks to the January surge and the strong demand since, this year is on pace to show the strongest Chinese gold demand since 2019.
While we’ve yet to get a good read on the latest state of central bank demand, it’s important to remember that buying from the PBOC and other central banks is largely price-insensitive. Add in the fact that domestic Chinese buying, which has traditionally been very price sensitive, has become the precise opposite as investors and savers follow the price upward...and we have a recipe for consistent and strong buying.
As usual, most of the volatility can be accredited to Western traders, whose weak hands are evident with the bouts of selling we’ve seen following Fed minutes releases or other rhetoric.
Still, there have been encouraging signs that at least some Western investors are buying into the gold story, with important validation coming from silver and mining stocks, both of which have been outperforming gold itself.
Simply put, this is a new gold bull market, and one that will continue for years. A big reckoning is ahead, and we’ll want to own physical gold and silver, and the investments that will leverage their gains, well beforehand.
Editor's Note: Omar Ayales is the Senior Trading Strategist & Editor at GCRU (Gold Charts R Us). If you have any questions, you can reach him at oayales@adenforecast.com or visit www.goldchartsrus.net.
Hard Stuff
Inflation & Gold
By Omar Ayales
The relationship between both is closer than you would expect. In fact, throughout history, gold’s strongest and most durable up-moves have been closely linked with inflation or the growing expectation of it.
The main reason is that historically gold has been the world’s currency and the ultimate safe haven.
Gold’s status as the world’s de facto currency is not a recent development but a testament to its enduring value. Over millennia, gold has served as a universally accepted form of currency and a symbol of financial security, earning the trust of financial authorities, be they a central bank or the royal treasurer.
Gold is a unique currency that cannot be debased by monetary authorities, as opposed to fiat currencies like the U.S. dollar and others when the money supply is increased in a way that outpaces the demand for that currency.
In other words, “too many dollars chasing too few goods” … The very definition of “Demand Pull Inflation”.
It’s commonplace for sovereigns globally to expand their money supply. However, monetary expansion has been stronger over the past 15 years than at almost any other time in history. And in the last 4-5 years, since COVID-19, the monetary growth curve has gone parabolic without signs of a meaningful reversal anytime soon.
All of this excess money is not free and doesn’t come cheap since most of it has been created by the issuance of treasuries (debt). And it seems unlikely for this debt to be repaid. Rather, it’ll likely be debased, which means fiat currencies will continue to devalue.
And looking at other mega global trends, like near-shoring, global fragmentation, and growing geo-political conflict, it doesn’t seem like things will get cheaper anytime soon.
As Richard Russell would say: “Inflate or Die”.
The direct effect is the rise in real dollar terms in goods and services, particularly those mostly sought. It will continue to fuel a rise in the price of gold, silver, copper, base metals, other resources, particularly energy.
The demand for even more debt to make interest payments and keep the ball rolling will continue to push interest rates higher at the long end of the curve. It will put strong pressure on monetary authorities like the Fed to at the very least keep overnight rates at current levels.
Because interest rates are a response to inflation, interest rates on treasuries that have large markets (larger than their own sovereign issuer’s demand), will tend to move with gold. This means, gold tends to move against the treasury itself. Something that seems counter-intuitive given gold’s more recent relationship to bonds since the year 2000.
However, a 60-year view of gold, together with benchmark interest rates, shows that gold has moved more with yields than treasuries.
Notice the chart below. It shows gold together with the U.S. 90-day T-bill rate.
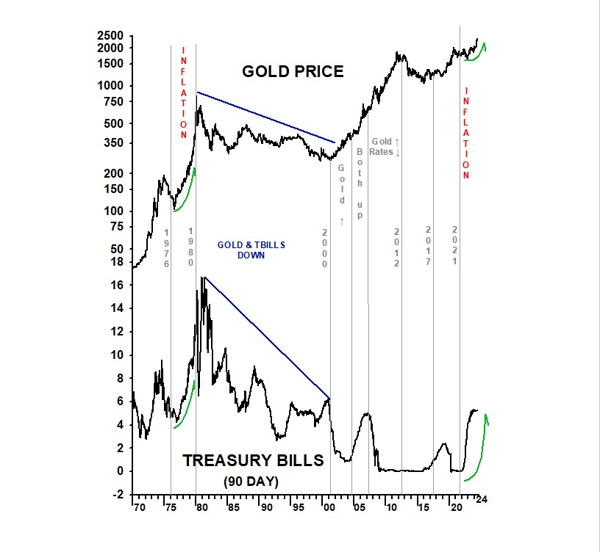
Notice the first up-move from 1970 thru the peak in 1981-83 and the subsequent decline, of nearly 20 years for both gold and the 90-day T-bill rate. Then, gold bottomed while rates fell further as central banks kept rates artificially low in response to the dot.com bust.
Rates quickly bounced up after, catching up to gold. However, rates then peaked while gold kept on rising. Falling rates this time were in response to the financial crisis of 2008. In both times, the disconnect with gold was orchestrated by monetary authorities.
Thereafter, gold and the 90-day T-bill rate started to rise since bottoming in 2015-16. But back in 2020, the Fed once again dropped rates to zero in response to Covid-19. Gold peaked to an all-time high later in Aug 2020. Gold has since stayed at a higher level as rates show upside pressure once again.
Gold’s major disconnect with long term treasuries happened in 2022, when gold bottomed before starting to build a stronger up-move. Back then, treasuries fell to a new low and kept falling. Since then, gold has been rising together with rates.
Noteworthy, the recent up-move in interest rates since 2022 is breaking above longer-term mega trends that develop over 40 years approximately. The last mega trend having started back in 1981 when rates peaked, ending in 2020, at the end of a decade long of Zero Interest Rate Policies.
Price action now suggests higher rates for longer. Not in a linear way, and not without pull backs and secondary reactions. But higher for longer no doubt. A trend that could take 30-40 years to fully develop. This also means higher gold for longer, higher silver and copper, most base metals, energy, especially crude oil, coal and nuclear energy.
Get ready to our new normal of higher inflation and price volatility for longer.
The Inside Story
In Gold We Trust 2024
By Ronald Stöferle and Mark Valek
Since 2007, the annual In Gold We Trust report has been regarded as the standard work for every interested gold investor. But the In Gold We Trust report is much more.
Each year Ronald Stöferle and Mark Valek undertake a comprehensive macroeconomic analysis and examine the trends of the present, learn from the past with an eye on the future. To understand them, fundamental workings of the financial and economic system must be explored and critiqued. Every year, the In Gold We Trust report looks at the top issues in the financial world. In its method of analysis, it roughly follows the Austrian school of economics.
The new In Gold We Trust-Report was published on May 17, 2024.
|