|
Perspective
By Rich Checkan
Is this it? Is this the end?
After the carnage of late in the stock markets worldwide, I cannot help but think of that song by the rock group REM… “It’s the End of the World As We Know It (…and I feel fine).”
On Monday, the Dow fell 2.6%, the S&P 500 fell 3%, and the Nasdaq Composite fell 3.4%. Europe was a bit tamer. The stock markets in France, Germany, and the United Kingdom fell 1.4%, 1.8%, and 2%, respectively.
Japan was not so lucky. The NIKKEI’s 12.4% drop in a single day was that stock markets worst performance in 37 years! The losses were reminiscent of “Black Friday” on October 19th, 1987.
Apparently, there are some real fears that the United States is heading into a recession. Following Friday’s anemic report from the labor market, there is the prevailing sense that Federal Reserve Chairman Jerome Powell and his cohorts on the Federal Reserve waited too long to cut rates.
The world seems to believe they have broken something… the world’s largest economy to be exact.
Gold and Silver Sell Off
Casual observers of the gold and silver market would be surprised to hear that gold and silver fell in price right alongside the world’s stock markets.
This seems odd to many. After all, gold and silver are your wealth insurance. Why would the price drop when you needed them most?
Margin calls.
When the stock market drops precipitously, the many and varied leveraged accounts (those where investors took loans against their stock portfolios to reinvest into more stocks) faced margin calls. The value of the assets dropped below the value of the loan, so there was an immediate need to come up with cash to keep from losing everything.
Where do investors get cash in a crisis? Where do investors find liquidity?
That is right… gold and silver… two of the most liquid assets known to investors.
We see this time and time again as stock markets correct.
Initially, gold and silver fall right alongside stocks… until the bleeding has stopped. Once things settle down, gold and silver prices are the first assets to recover. Since they did not fall in price for any fundamental reason, opportunists jump in and start buying cheap gold and silver by the handfuls.
This is the classic example of a bull market dip in gold and silver. This is an opportunity to embrace. This is NOT something to be feared.
Are you ready to buy well to secure your future?
To Cut, or Not to Cut
After Monday’s carnage, everybody was out talking about emergency rate cuts prior to September’s Federal Open Market Committee (FOMC) meeting. Everybody was screaming about how the Federal Reserve should cut rates three to four times by the end of this year.
What do you think? I would love to hear your thoughts. Email me.
Personally, I am not so sure.
I am still not convinced inflation is under control. By the Federal Reserve’s own guidance – even though it softens meeting by meeting – we are not yet to that magical two percent number.
In fact, we may never get there.
But there is a case for protecting against further damage to the labor market. And God forbid we have a nation full of people that feel poor due to a precipitous drop in the stock market just a few months before an election.
That all being said, given the Federal Reserve’s own guidance, if they do cut rates either before or at the September meeting, it sends a clear signal to me that the Federal Reserve is only acting to fulfill their third, unspoken mandate… the stock market put.
Their two public mandates are to ensure price stability and to maximize stable employment.
However, since Alan Greenspan jumped in to protect stock market investors after the “Black Monday” stock market crash 37 years ago, the third mandate to protect stock market investors and Wall Street has been on the table as well.
The next few months will be quite interesting.
Time to Embrace Opportunity
Success is when preparation meets opportunity.
The opportunity is here. Have you prepared to be successful?
Gold and silver are poised to go higher in price. They have consolidated for five years now. And the stock market sell-off earlier this week caused investors who were underwater to sell gold and silver to salvage their portfolios.
The result is a bull market dip for you to embrace.
If you have the cash, here is your opportunity to buy well.
If you do not have the cash right now, find some elsewhere in your portfolio, or look to your self-directed Individual Retirement Account (IRA).
You have a chance to buy gold and silver very well here. Embrace the opportunity. Make your own success.
Embracing this opportunity right now, is the best way I know for you to Keep What’s Yours!
Buy on our website directly… www.assetstrategies.com. Call us at 800-831-0007. Or send us an email.
Got Gold?!?! Got Silver?!?!
—Rich Checkan
Editor's Note: Jim Woods is the editor of the Successful Investing, Bullseye Stock Trader and High Velocity Options investment advisory newsletters. He’s also the editor of The Deep Woods, a free weekly e-letter devoted to presenting an uncommon take on money, ideas and society. You can access all of his work at JimWoodsInvesting.com.
Feature
What Happens When the Yield Curve "Un-Inverts"?
By Jim Woods
Question: If an inverted yield curve (yield on shorter-dated Treasury bonds is higher than on longer-dated bonds) is a recession warning signal, does that mean when the yield curve un-inverts (and turns back positive) it’s an economic all-clear signal?
This is not only a reasonable question, but it’s one that I’ve been asked several times of late (usually by my wonkier market followers), and the reason why is because after more than two years of an inverted yield curve, the benchmark 10s-2s yield curve spread is near multi-month highs and threatening to turn back positive (un-invert) for the first time since mid-2022.
Now, if an inverted yield curve means recession on the horizon (which we have yet to see), then does the un-inverted curve mean an economic “all clear” on the horizon? The answer is no, it would not. And perhaps more importantly, it would be especially negative for the stock market according to recent market history.
Thanks to my friends at Sevens Report Research for working up the following market statistics and analysis: Since 1998 there have been six inversions of the 10s-2s yield spread: June 1998, February 2000, January 2006, June 2006 and, more recently, August 2019 and July 2022.
Three of those inversions, June 1998, January 2006 and August 2019 were extremely limited to around a month in 1998 and January 2006, and just a day or two for the August 2019 inversion. Because the current inversion is over two years old, I don’t think analyzing those three instances is particularly useful, as they sent a much different economic signal than the longer inversions.
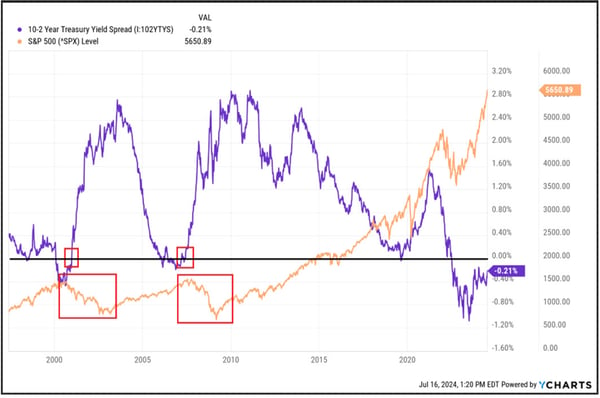
The inversions of early 2000 and 2006 were much longer (just under a year in both instances) and are more analogous to the current inversion, which again is more than two years old. Because of this, we think the following conclusion is notable: In both prior instances (2000 and 2006) the 10s-2s yield spread un-inverting (so turning back positive) was a decidedly negative signal for stocks.
Looking at the early 2000’s inversion, the 10s-2s spread turned back positive on December 29, 2000, when the S&P 500 was trading at 1,320. The S&P 500 declined for the next 22 months, bottoming out around 785 in October 2022. The S&P 500 didn’t return to 1,320 until the third quarter of 2006!
Looking at the next example, the 10s-2s spread turned back positive on June 6, 2007, after being inverted for nearly a year. On June 6, the S&P 500 was trading at 1,517. The S&P 500 declined for the next 21 months, bottoming out around 670 in March 2009. The S&P 500 didn’t trade back above 1,500 until the first quarter of 2013.
We appreciate this is a somewhat simplistic look at things and that this era is not the same as the tech bubble burst of 2000 or the housing bubble burst of 2008. But we do think this is worth pointing out for a simple reason: 10s-2s turning back positive is both logically and practically a warning sign of an imminent economic slowdown. Here’s why.
When 10s-2s turns back positive, it’s usually because the 2-year Treasury yield is falling quickly as investors price in aggressive rate cuts (which is already happening now thanks to the dovish July FOMC meeting). Rate cuts usually occur because the Fed is worried about economic growth. That’s happening right now, as the market prices in 100% chances for a September and December rate cuts and a growing chance for a third cut this year.
The 2-year yield has declined from a high of 5% in April to 4.19% (on Aug. 1) (and more than half that decline has come in the past month). That’s the market pricing in Fed rate cuts and the net result is a rise in 10s-2s as the spread has increased from -50 basis points in June to a high of -16 basis points in July (on July 31 it was -20 basis points).
The point here is the yield curve is getting close to un-inverting and that may be heralded as a positive by the financial media. However, for inversions that are lengthy (and this one is extremely lengthy) the 10s-2s yield spread turning back positive is not historically a positive event and may, in fact, be a signal for equity market volatility.
As such, the rise in 10s-2s is reinforcing concerns that investors are under appreciating the economic risks facing this market in the coming quarters and instead are viewing the world through positively tinted glasses. I very much hope they are right. I hope this time is different than 2000 and 2006 and given how stretched the S&P 500 is on AI enthusiasm and how the rest of the market is trying to quickly catch up, it better be different this time, otherwise this is not a positive set up for investors.
We’ll continue to watch 10s-2s closely and when it un-inverts (turns back positive) we’ll know that, historically, it’s time to increase portfolio vigilance.
Editor's Note: Adrian Day is president of his eponymous money management firm, offering discretionary accounts in both global markets and resources. He also manages the Europac Gold Fund. To see if a managed account might be right for you, call ASI and we'll make the connection. Call 1-800-831-0007 for more information.
Hard Stuff
Gold Stocks are Very Attractive on Low Valuations and a Strong Gold Outlook
By Adrian Day
Gold stocks offer a very attractive and very unusual opportunity now, with low valuations amid a positive outlook for gold as the Federal Reserve gets set to follow central banks from Europe and the U.K. to Canada and cut rates. Historically, that has marked the start of a strong bull market for gold.
Gold stocks have lagged gold itself over the past year and that is not really surprising. The main drivers of gold have been central bank buying and Chinese retail investors. We know that central banks are looking to diversify their reserves away from the dollar as concerns grow about the weaponization of the dollar and global financial system controlled by the U.S. As for Chinese investors and savers, they are worried about their economy. They are afraid of the safety of their banking system, not wanting to buy local stocks, down 40% in three years in a relentless slide, afraid to put money into real estate, the traditional Chinese destination for savings, and prohibited from buying crypto. That leaves gold as a safe haven.
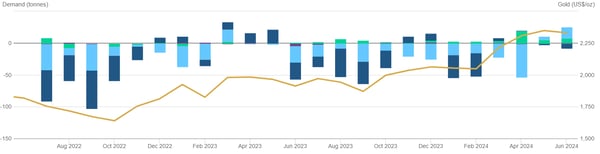
Selling in the West Continues
In the Western world, however, there has been continual selling of gold. We can see this in coin sales, with low premiums and declining deliveries from the mints. Similarly, gold ETFs in both North America and Europe continued to see net outflows until June, even as the gold price flirts with all-time highs. Asian ETFs—green in the accompanying table—have seen inflows, but not sufficient to offset outflows from the West.
It is the same situation with gold stocks. They have lagged bullion as gold equity ETFs continue to see massive outflows, as do gold mutual funds.
Why the disconnect? It becomes clear if one looks at who is buying and why. Central banks and Chinese savers do not buy gold stocks; they buy physical and for reasons described above. Western investors particularly in the U.S., however, look at high interest rates, low and falling inflation, strong economy, low unemployment, a strong dollar, and a strong stock market. This is precisely the macro environment that should be weak for gold. So it is not illogical that western investors have been selling.
Rate Cuts Ahead Amid Deteriorating Economy
All that is about to change however, as central banks start to cut rates amid clearly deteriorating economies, while stock markets come off their all-time highs. The U.S. economy is no where near as strong as headlines, repeated by the media and politicians, would suggest. If one looks under the hood, things are quite different.
• Notwithstanding recent weakness, the unemployment rate remains low and new jobs creation strong, according to the media. But there are signs of distress behind the bald headline numbers. As we know, there is a huge gap between the Payrolls Report that generates the headlines and the Household Survey. The labor participation rate is near 40-year lows, reducing the denominator. The number of people being forced to work two jobs to make ends meet is not a sign of strength. The percentage of new government jobs is rising.
In fact, there has been a loss of over 1 million full-time private sector jobs over the past year. That is not a sign of a strong labor market.
Now the famous Sahm Rule has been triggered. This is when the three-month average unemployment rate crosses over the 12-month rate by over half a percentage point. It has a very strong correlation with the onset of a recession, going back into the 1970s.
• Consumer spending continues to increase, suggesting the consumer is still strong. But spending has increased at a lower rate than prices have accelerated, meaning the consumer is buying less in terms of volume or reducing perceived quality by shifting from Neiman Marcus to Walmart. The reduction in savings and the rise in credit card debt means the spending is sustained, not by income, but by debt and is therefore not sustainable. The rise in credit card defaults suggests that we may soon see spending decline.
We could look at other areas of consumer debt, such as used auto loans, and see the same increase in debt and defaults. The consumer is not strong, certainly not the lower 50% of the population in terms of net assets or income.
Overall, the economy is moving rapidly into a recession. We know that monetary policy works with long and variable lags. Not coincidentally, the average lag from the first rate hike to the onset of a recession is 27 months. And July marked precisely 27 months after the Fed first raised rates in this cycle.
Inflation is Not Under Control, Suggesting a Stagflationary Period Lies Ahead
• The reported inflation numbers have come down, though still running significantly above the Fed’s own arbitrary target. With the CPI and PCE running over 3%, that means inflation is more than 50% above the Fed’s target. And we will likely start to see some higher numbers in the fall as the year-ago numbers declined. We could see the oil price move back up to the mid 80s and a higher oil price will feed into all goods in the CPI.
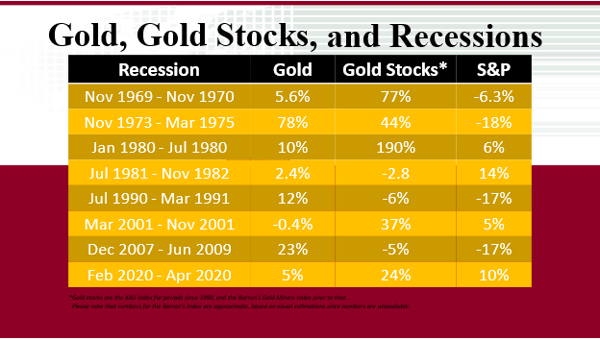
So it is almost certain that the economy is moving into a recession, and more-likely-than-not that it will be a stagflationary period with stubborn inflation higher than any growth in the economy. Historically, during recessions, both gold and gold stocks have tended to perform well in real terms, with gold stocks usually outperforming the broad market as well. During stagflations, however, gold stocks have tended to be the top-performing asset. Recessions are not good for gold per se, but rather the perception during recessions that the central banks will cut rates, and that is positive for gold.
As the Federal Reserve moves towards its first rate cut, it joins central banks from Europe and the U.K. to Canada, in lowering rates. In rate cutting cycles back to 2000, gold has moved sharply higher when the Fed first cuts rates.
Gold Stocks are Very Undervalued
As the same time, the gold stocks are remarkably undervalued, relative to their own history and relative to the broad market. It is unusual to see the gold stocks trading at lower multiples and higher yields than the broad market as they do today. And on many valuation metrics, many gold stocks are trading at multi-decade lows: Agnico Eagle, for example, the third-largest gold miner in the world, is trading at more-or-less at its lowest price-to-cash flow multiple in 40 years.
That is stunning undervaluation when gold is flirting with record highs and the macro-economic environment is about to turn positive for further moves.
The gold sector is very small, something less than $600 billion for every gold company in the world; the largest, Newmont, is just $55 billion. Compare those valuations with Nvidia that can move more than $200 billion in a single day. When investors start to trim exposures to the major tech companies and put even a little of that into gold stocks, the returns will be very strong. Historically, gold stocks have doubled, quadrupled, quintupled and moved 800% in a matter of just a few years in previous bull markets. And right now is a very unusual opportunity where the gold stocks have actually lagged gold. Typically, at the beginning of a bull market, gold stocks shoot up very quickly overtaking gold. In 2001, for example, the XAU jumped 50% in the first three months, outperforming gold, up just 12%, by a wide margin.
This year to date, gold is up over 18% while the gold stocks are up less than 16 %. This is a rare and very attractive opportunity to buy the gold stocks while they are fundamentally inexpensive and before they have surged ahead of bullion.
Editor's Note: Bill Bonner is the Founder of Bonner Private Research and owner of the Agora Companies. This article was originally published by Bonner Private Research on July 30, 2024. You can subscribe to Bonner Private Research here.
The Inside Story
Lies, lies, lies...
By Bill Bonner
The ‘greatest economy ever’ is the one no politician can create. It’s where people are free to decide where, how and when to spend their time and money. Only then do they get what they really want...
The news this morning, Cryptopolitan:
US debt hits all-time high over $35 trillion
Another milestone... on the road to Hell.
Mentioned yesterday were claims that we have the "greatest economy ever."
Both Donald Trump and Joe Biden have said so. Both claim to be its creator.
Herewith, a paternity test.
In the first place, the ‘greatest economy ever’ is the one no politician can create. It’s where people are free to decide where, how and when to spend their time and money. Only then do they get what they really want... which is what an economy is meant to provide.
Every interference — taxes, war, tariffs, subsidies, regulations, inflation — subtracts from the greatness.
This point is puzzling and frustrating to mainstream economists. They think GDP growth is all that matters. Or low unemployment. Or low inflation. They think these things are policy choices... and they pretend that they — the elite — know how to get them.
But imagine that they come up with the idea of digging a huge transcontinental canal... from Los Angeles to New York. To get the job done, they hire millions of people to work on it... and pay them each $100,000 per year.
The project is, of course, cockeyed from the get-go. It would actually lower the real wealth of almost everyone... by diverting time and resources from things that people really want to things almost no one wants.
But the key metrics — GDP growth and employment — would soar. It would be the ‘greatest economy ever.’
Of course, they’d have to pay for it with printed-up credit dollars. But the inflation effect would be downstream, not immediate.
By the Numbers
If you look at real GDP growth per person, you see that Donald Trump’s administration trailed Kennedy, Johnson, Truman, Reagan, Clinton, Carter, Ford, Nixon, and Obama, with an annual gain of 1.03%, compared to nearly 4% for the Kennedy/Johnson years.
But there’s more to the story. The Covid hysteria showed up on Trump’s watch. It was a medical concern. Trump turned it into an economic disaster. He forced millions of people to stop working... greatly lowering output.
Then, to make up for lost real wealth, he provided phony wealth — trillions in "credit dollars." Even with so much cash sloshing through the system, however, the economy was weak. Growth in final sales (more reliable as a measure than GDP... people can decide to buy, or not) were actually weaker under Trump than they had been under Obama, 1.52% compared to 1.74% — the lowest increase in final sales in the last seventy years.
His supporters maintain that we get a more accurate view by looking at his pre-Covid performance. But even there, Trump’s results were poor. Final sales through the first quarter of 2020 were still lower than those under Obama in his last quarter.
Nor was there any real improvement in the jobs metric. Obama’s second term saw an increase of 215,000 jobs per month. Trump, pre-Covid, added 185,000 per month.
A better measure of ‘employment’ is the hours worked, not number of jobs. Here again, no cigar from Donald Trump. David Stockman:
To wit, during Obama’s second term the index of total hours work rose by 1.80% per annum compared to 1.67% during the Donald tenure through February 2020. So, again, the Trump growth rate for the period prior to the Lockdowns was well below the 2% average between 1964 and the year 2000, not evidence of the Greatest Economy Ever.
The whole idea that the president ‘creates’ jobs... or boosts GDP... or makes people better off — is mostly baloney. A president only makes people better off by helping to get the government off their backs so they can produce/trade/save/spend as is their wont.
In this regard, a tax cut is generally a plus. But only if it is brigaded together with a spending cut. Otherwise, it just shifts the burden from the present (taxation) to the future (inflation).
But sticking with the statistics — if only to show that even in their own terms, neither Trump nor Biden presided over the "greatest economy ever" — we see that at the end of The Donald’s term there were three million fewer people with jobs than there had been when he started.
Finally, after Trump failed to create the greatest economy ever, Joe Biden tried his hand.
He began in the typical manner — by flooding the economy with more credit dollars. Between Trump’s first stimmie... and Biden’s cherry-on-the-cake "Inflation Reduction Act"... the feds pumped some $8.12 trillion in free money to America’s money-hungry millions.
The world had never seen so much stimulus. You’d think the economy would be white hot, right?
Well, in May of this year, real disposable income per capita stood at $50,491. That was actually lower than the $50,635 figure for May 2021. In other words, the biggest burst of stimulus Planet Earth has ever seen produced zero increase in real wealth for most people.
And between 2016 when Donald Trump entered the White House... through to the end of this year (we are anticipating)... the feds will have almost doubled the nation’s debt. This ‘investment’ — nearly $17 trillion — supposedly produced the two greatest economies the US had ever seen.
Lies, lies, lies...
|