.png?height=200&name=goldsilverportfolio_600x300%20(1).png)
The Gold-Silver Ratio (GSR), which reflects the amount of silver its takes to purchase one ounce of...
The Gold-Silver Ratio (GSR), which reflects the amount of silver its takes to purchase one ounce of gold, has been at highs for an unprecedented period. What does that mean for gold and silver investors? Here’s why you should be paying attention in 2025…
The GSR fluctuates depending on the current value of gold and silver. If you’re looking to invest in either precious metal, monitoring the GSR for its highs and lows could impact your investment significantly. Historically, whenever the GSR has soared to highs above 80, investing in gold and silver has been quite fruitful.
Right now, the GSR hovers around 90, which means it takes approximately 90 ounces of silver to buy one ounce of gold. At times like these, when silver is still highly undervalued compared to gold, there is typically a rush to take advantage of lower prices in the silver market. Yet, puzzlingly, we haven’t seen that happening so far in the bull market. Silver is still highly undervalued at current prices, and arguably, investors are missing out on potential gains.
.png?width=600&height=300&name=goldsilverportfolio_600x300%20(1).png)
Historic Highs
In March of 2020, gold prices skyrocketed as investors flocked to the yellow metal as a safe haven during pandemic-related market volatility. Both gold and silver spot prices dropped initially as the stock market plummeted and investors sold off precious metals to meet margin calls. However, silver did not see the same recovery as gold, so when gold spot prices rose and silver spot prices remained low, the gap widened significantly.
The gold/silver ratio increased to over 125 to 1 on March 18, 2020, well above its former all-time high. Arguably, the gold/silver ratio at that time was the highest it has been in over 5,000 years; literally since the emergence of gold and silver as tradeable commodities.
From there, despite some brief moves higher in early 2021, silver tried and failed to play catch-up as the precious metals bull market got underway.
You see, typically the GSR responds to extreme highs by correcting downward. This is the result of silver outpacing gold as both gold and silver prices rise from the lows. While the all-time highs we saw in 2020 are unprecedented, gold and silver seemed to otherwise follow historical patterns… with a narrowing of the GSR as the market turned bullish for both gold and silver. Yet, something else is afoot as the GSR has been sustained at a higher level for an unusually long time...
Historic Lows
When the GSR drops into a range from 35 to 50, there is commonly a rapid surge in silver selling. At those times, when the GSR is at its low point, the price of gold is cheap compared to silver. In April 2011, for example, the ratio plummeted to a low of 32.4! At this ratio, silver was selling for $48 per ounce and gold for $1,500 per ounce. At those prices, it’s easy to see why investors were eager to sell silver. The ratio took an even larger plunge in 1980, when it dropped to around 18!
As mentioned above, due to the high levels of the current GSR, despite gold spot prices regularly making new all-time highs, both gold and silver are incredible buys right now. At these GSR levels, the market is starting to heat up, so while the GSR has come down a little, it is still signaling the lower end for both gold and silver prices in this stage of a precious metals bull market. There’s a lot of exciting price action we can expect over the next few years. At this point, gold at $3,000 an ounce is well within reach, and we could see silver much closer to its’ previous high of $50 an ounce, or beyond.
Generally, silver tends to be more volatile than gold, thus resulting in comparatively larger moves up and down when market forces are active. On the whole, silver usually follows the movements of gold; however, it will occasionally gain strength on gold due to its numerous industrial uses. More importantly, silver trade is a much thinner market than gold. So, the same dollar has a bigger impact in the silver market than it does in the gold market.
Silver follows its leader—gold, but silver will invariably out-pace gold as they both move the same direction—either up or down.
The Magic Number
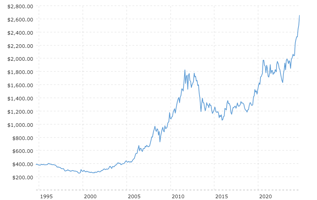
When you see us talk about the GSR, we typically mention a “magic number” of 80 for the ratio. The GSR has only reached 80 four times in the past two decades. Each of the three previous times it did reach 80, the ratio responded by correcting downward roughly 40% to 60%! This effect was the result of silver outpacing gold as both gold and silver prices rose from the lows.

In the chart above, you will notice that the timespan between the four instances that the GSR reached 80 is about 6 to 7 years. The time the GSR took to fall 40% to 60% after reaching 80 was roughly 2 to 3 years.
However, the GSR has entered uncharted territory these past few years...
Since 2018, the GSR has been historically high, and since peaking at 125 in 2020, it has correct and continued to hold around the 80-85 level. This is unusual for it to be so high for so long.
And this strange trend is set to continue as long as the gold bull market is buoyed by central bank gold buying, and not retail investors entering the market. This is one of the main reasons why gold is at all time highs, yet silver is lagging far behind. Central banks have been adding to their gold reserves at historic rates and Asian investors have started to buy as well, while the silver market is mainly being driven by industrial demand and much softer retail demand.
Still, silver and gold rose significantly in 2024, and in this climate of extreme geopolitical instability, precious metals stand poised for continued gains in 2025. Once individual investors buy into this sustained rally, the GSR should narrow as gold and silver demand and spot prices spike.
The best for gold and silver is yet to come.
What Does This Mean for You?
Generally, it’s important to consider three courses of action when choosing to invest when the GSR is high…
- Insurance—If your overriding objective is to buy precious metals for insurance, consider buying some insurance—gold.
- Speculation—Considering the volatile nature of silver, with wider swings to the downside followed by wider swings to the upside, profit-motivated precious metals buyers may consider purchasing some silver.
- Trading—Historically, this is the most common use of the GSR indicator. Traders will look to the height of the GSR—near this ‘magic number’ of 80—to sell some gold and buy some silver with the proceeds. Then, when the GSR hits new lows, they sell the silver and buy back gold.
Taking action is especially important now as we advance further into this precious metal bull market. Whether you choose gold or silver, we have two helpful tips you can consider before making your investment…
If insurance is your prime motivator, buy both gold and silver… but weight your purchase toward gold.
If profit is your prime motivator, buy both gold and silver… but weight your purchase in favor of silver.

As mentioned before, a high GSR is the ideal opportunity to invest in gold and silver. Gold is touching new all-time highs every few weeks it seems, but silver still has a long way to run. For context, in the last bull market, gold saw gains of 650% while silver jumped up by 1,000%. If historical patterns are to be followed, then gold and silver should continue to rise until the GSR drops to the low end of its range.
The Gold-Silver Ratio is still well above 80, so a clear buying opportunity is currently present at these fundamentals. Yet, western retail investors have not been heeding the call to start buying. Have you? Now is the time.
Give us a call at 800-831-0007 to take action, or visit www.assetstrategies.com to explore our wide selection of gold and silver bullion products and live pricing.