|
Perspective
By Rich Checkan
By this time last year, just one month into the new year, gold was down one half of one percent. From there, gold would fall to a low for the year over the summer… down 10%.
In that six-month period, the U.S. dollar surged nearly 20%.
By the end of the year, the U.S. dollar would give back 10%, and gold would take back 10%... finishing the year flat. And that performance by gold, against a strong U.S. dollar headwind, was nothing short of phenomenal.
In fact, flat gold was good enough to out-perform the major U.S. stock indices by a country mile…
• 9% better than the Dow Jones Industrial Average
• 19% better than the S&P 500
• 33% better than the Nasdaq
Oh… and gold bested the speculative cryptocurrency, Bitcoin, by 64%.
Keep What’s Yours!
Gold helped us all do just that last year.
For forty-one years now, we have been selling gold mainly as wealth insurance. It is the absolute best asset we know to help you preserve your purchasing power against a mismanaged fiat currency that has lost over 95% of its purchasing power since the Federal Reserve was created in 1913.
Does anybody see a connection here?
With gold tethered to the U.S. dollar until 1971, it was hard to completely mismanage the currency. It took emergency powers to devalue the dollar back in 1933.
President Franklin Delano Roosevelt did not want anything to do with your gold. Instead, he wanted to devalue the U.S. dollar. So, the U.S. government confiscated gold in order to turn around and raise the “official” gold price.
In so doing, they devalued the dollar… their ultimate goal.
However, by 1971, the mismanagement of the U.S. dollar had gotten out of hand. The government was overspending on a policy of “guns and butter.” They were spending money we didn’t have on a proxy war in Vietnam while they spent money domestically on a whole host of social welfare programs.
Then, the rest of the world started asking for their gold back.
Rather than deplete the vaults, President Nixon removed the convertibility of gold and the U.S. dollar… officially “closing the gold window.” Since that fateful day of August 15th, 1971, the wheels have come off the apple cart.
Take a look at the chart below…
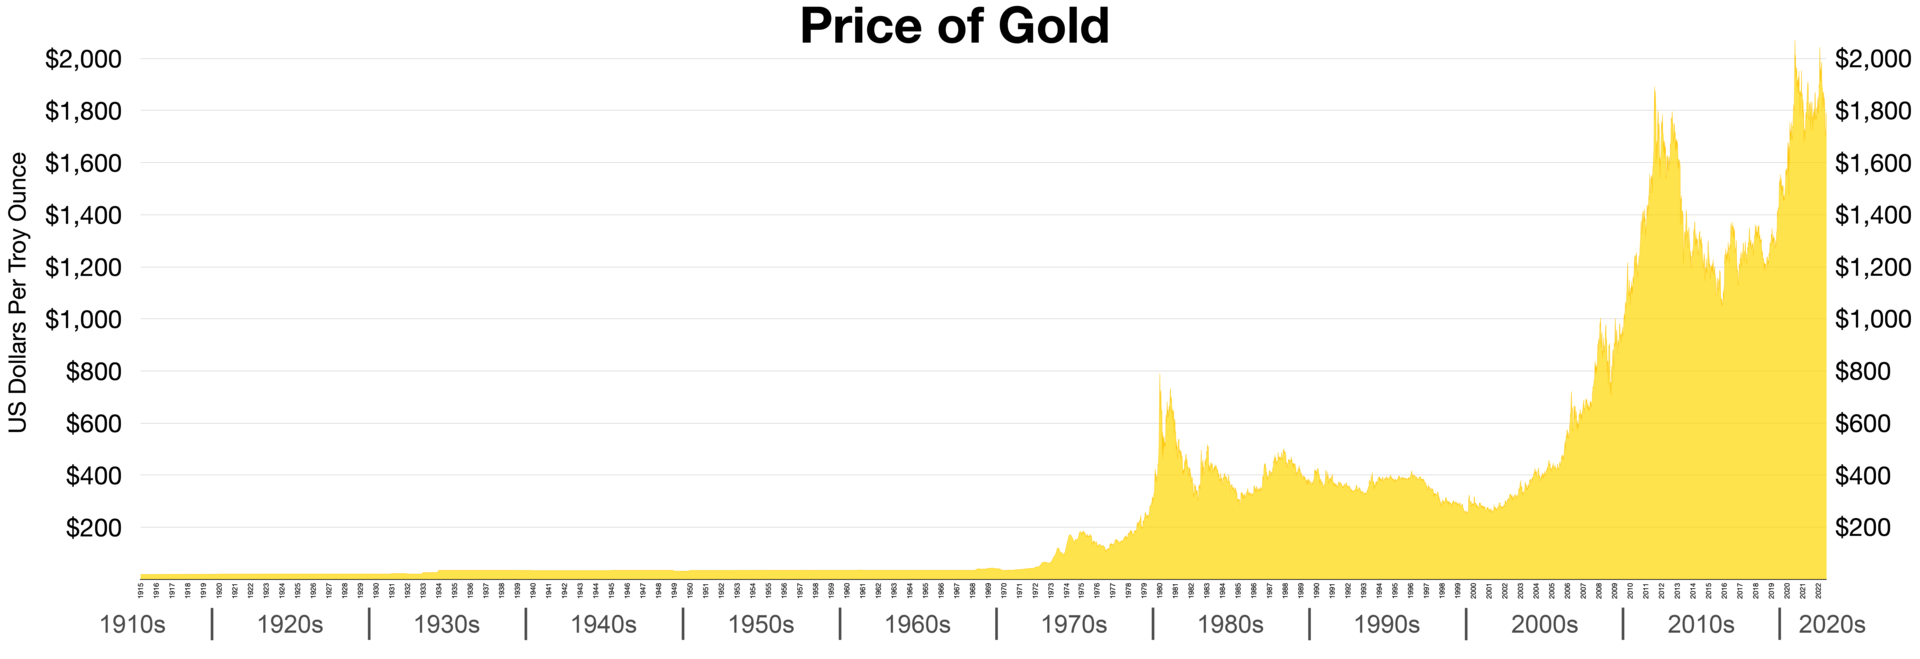
It is so clearly obvious where the Congress was no longer bound to operate within a budget… to balance the government’s checkbook.
Overspending on pet projects to gain or secure influence became the new normal. Debt ceilings were no longer there to limit spending. They were now only meant to let politicians play politics before eventually raising the ceiling and overspending some more.
Every new crisis was an excuse to spend, spend, spend.
• The War on Drugs
• The War on Terror
• The Great Financial Crisis
• The Covid-19 Pandemic
All led to a massive increase in debt. All were excuses for government overspending. All weakened our currency and our economy.
All saw the U.S. dollar weaken as gold preserved the purchasing power of the money you worked so hard to earn with your time and talent.
One Month Into 2023
This year is starting off a bit differently than 2022.
To start this year, gold, the equities markets, and Bitcoin all moved higher in January. The U.S. dollar continued the weakening trend we saw in the final quarter of last year.
Then, a little data came out…
The Consumer Price Index (CPI) – although still much higher than a year ago – was receding slightly. The Producer Price Index (PPI) – although much higher than a year ago – was receding slightly. And jobs numbers dramatically surprised to the upside for the month.
As Federal Reserve Chairman Jerome Powell announced his scaled back quarter point interest rate hike decision last week Wednesday, investors started to worry that rate hikes would continue.
Why?
Well, the aggressive rate hikes of last year seemed to be working. AND… they appeared not to have any detrimental effect on the job market. Inflation was coming down, and nothing really appeared to be broken.
This worries investors who were hoping for a pause in interest rate hikes to be followed by a pivot.
That concern along with a little profit-taking are no doubt responsible for the pullback in equities and gold to start the month of February.
Well, that and one more thing…
U.S. Dollars
Last week Wednesday and Thursday, there was a complete about-face in the U.S. dollar. It had been falling for four months straight.
After touching a high of over 114 at the end of last September, the U.S. dollar fell steadily until it touched 101.75 at the end of January. That’s nearly an 11% fall in just four short months.
So, when gold dramatically turned south last week, I looked immediately to the U.S. dollar. Sure enough, it was up by exactly the same percentage as gold just fell. And that has continued into this week.
To me, this appears to be some sort of intervention on behalf of the dollar. Some entity must have stepped in to support the free-falling U.S. dollar. My guess is the U.S. Treasury, but time will tell.
Now, having said that, I am not a conspiracy theorist.
I understand – although I don’t agree with the practice – that Central Banks will occasionally, at key inflection points, step in on behalf of a currency. The goal is to defend the currency from overheating and from overcooling, and in so doing, maintain confidence in the currency.
Personally, I would love to see less meddling in markets and more fiscal responsibility.
But as Mick Jagger and the Rolling Stones often remind me… “You can’t always get what you want.”
What’s Next?
No change from what I said a month ago… except…
For me, the sell-off in gold last week changes nothing regarding my thoughts on gold in 2023. Nothing moves up or down in a straight line, and there are pullbacks in bull markets and rallies in bear markets.
Further, profit-taking and Central bank interventions tend to be short-lived phenomena. They tend to be events… not trends.
As a result, I believe we have been given a gift.
The long-term trend for the U.S. dollar should still be lower. The long-term trend for gold should still be higher. Temporarily, the prices for gold (and silver too) are cheaper than they ought to be.
Simply put, gold and silver are on sale.
Embrace this opportunity or regret missing out.
The time to buy with retirement and non-retirement funds is right now. The ball is in your court. You know how to reach us… Call us at 800-831-0007 or send us an email.
—Rich Checkan
Editor's Note: Omar Ayales is the Senior Trading Strategist & Editor at GCRU (Gold Charts R Us). If you have any questions, you can reach him at oayales@adenforecast.com or visit www.goldchartsrus.net.
Feature
The Path to Higher Inflation
By Omar Ayales
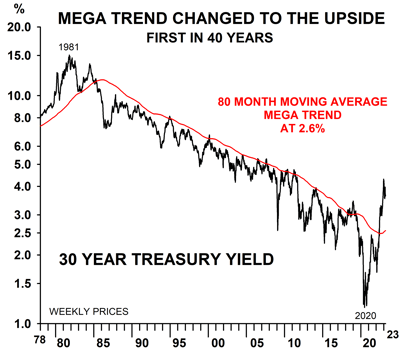
2022 will go down in history for many things, but the most important will prove to be the breakout rise in long term U.S. treasury yields…
The breakout rise is putting an end to a secular bull market that has lasted over 40 years, specifically 1981, the year long term rates on U.S. treasury notes peaked at about 15%. The new trend means higher rates for longer, higher inflation for longer despite conventional wisdom.
This doesn’t mean interest rates won’t fall or pull back. However, as long as the yield on a 30-year U.S. treasury holds above 2.60%, it’ll remain within its secular bullish uptrend that could last years, if not decades.
On the chart, notice the U.S. 30-year yield, since the peak in 1981 and the ensuing secular bear market that bottomed just last year. Notice the yield rising above secular resistance at the red line. The chart shows a clear breakout rise suggesting the 30-year yield may have entered into a secular bull market.
 Higher yields mean higher inflationary forces that many argue cannot be sustained as the U.S. economy is about to go into a recession as the lag effects of tight monetary policy seeps into the real economy. Higher yields mean higher inflationary forces that many argue cannot be sustained as the U.S. economy is about to go into a recession as the lag effects of tight monetary policy seeps into the real economy.
But although the U.S. economy might be cooling off, a strong labor market suggests the economy will remain hotter than many anticipate, keeping strong pressure on global demand for resources and energy. The recent jobs data released confirms economic resilience.
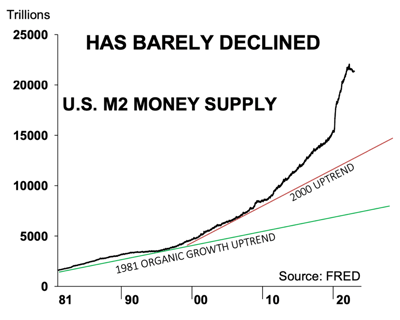
Moreover, despite the Federal Reserve’s strongest efforts, the available money supply in the U.S. remains heavily above its organic trend, which means excess liquidity remains trapped in the system which could contribute to the velocity of money as traders and investors look for higher yields in the current inflationary environment.
But it’s not only growth out of the U.S., it’s also growth from emerging markets, particularly China as it shifts away Covid Zero policies. China’s re-opening might not have the same effect as what happened in the U.S. but the waking giant is bound to put a dent on global demand for resources and energy regardless. It will be the first time in 3 years China fully re-opens its economy to the world…
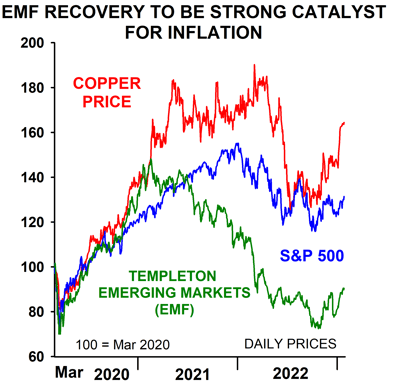
 Moreover, consider Emerging Markets (EM) and resources have moved together over history. More recently, however, specifically at the turn of the year from 2020 to 2021, emerging markets de-coupled from copper and resources. Copper and resources remained strong while emerging markets continued to decline to lower lows. Moreover, consider Emerging Markets (EM) and resources have moved together over history. More recently, however, specifically at the turn of the year from 2020 to 2021, emerging markets de-coupled from copper and resources. Copper and resources remained strong while emerging markets continued to decline to lower lows.
Notice on this next chart below a comparison between the S&P 500, the Emerging Market Fund (EMF) driven heavily by China and the price of Copper, indexed to 100 since the lows in Mar 2020. The chart shows EMF collapsing to new lows while the S&P 500 and copper kept rising together. Not surprisingly, at the turn of 2021 and into 2022, U.S. stocks peaked and started to fall; EMF remained near the lows and copper fell back.
Notice more recently copper has been up trending, together with EMF, even with the S&P 500 still down trending. The chart suggests if EMF recovered some of its lost ground, reversing to a mean, it could then put strong pressure on demand for copper and resources which could remain supportive of higher prices.
 The re-opening effect is bound to put strong upside pressure on energy markets too. It could be felt particularly by European countries and businesses as Europe will have to compete with China for a reduced share of available global energy (Russian sanctions remain in full force). The demand-supply crunch is bound to remain supportive of higher energy prices down the road, which in turn could keep strong upward pressure on inflation overall despite economic activity within the Euro-area. The re-opening effect is bound to put strong upside pressure on energy markets too. It could be felt particularly by European countries and businesses as Europe will have to compete with China for a reduced share of available global energy (Russian sanctions remain in full force). The demand-supply crunch is bound to remain supportive of higher energy prices down the road, which in turn could keep strong upward pressure on inflation overall despite economic activity within the Euro-area.
Another key element that is also contributing to higher prices is the under investment in the production of energy and resources. It has led to capacity destruction which leads to supply shortages. The growing demand and tighter supply given capacity restraints will likely keep upward pressure on prices for energy and resources, and therefore everything else.
And although the U.S. dollar index has been falling since the Sept 2022 peak, and has strong resistance at 110, it will remain longer term bullish above a key support level near 97.50. This means, the dollar index is likely to rise from here if it holds above the key support level, initially to 110, its first key resistance. A break above 110 and it’s off to the races…
Keep in mind foreign demand for U.S. dollars remains high, particularly as the Federal Reserve stays the course with its policy guidance. Moreover, relative to others, the U.S. economy remains robust, going into the year with one of the strongest job markets in post war history.
 The potential for ongoing strength is strong. The potential for ongoing strength is strong.
The higher rates for longer will change the way we invest. We must incorporate into our portfolios more gold, silver, resources, energy…. Commodities overall. It’s time to bet on emerging markets too. They’re due.
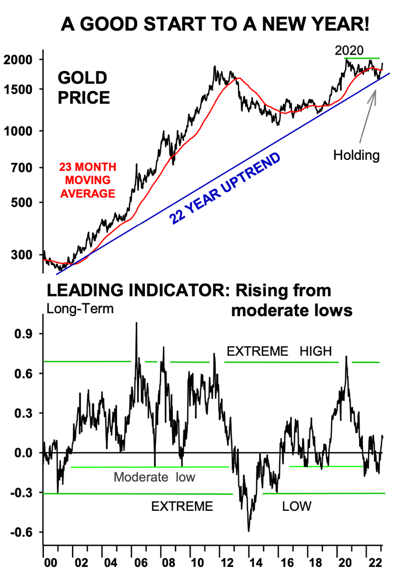
Gold’s recent rise since the second half of the year is very telling. It suggests the secular bull market it started in early 2000s is alive, well and strong. The secular uptrend suggests gold could peak once again in 2026, meaning that over the next few years, we are likely to see higher lows and new highs for the metals.
Notice on this next chart that captures the entirety of gold’s secular market how gold bottomed right at the uptrend during the washout lows of 2022. Notice it’s now rising once again, breaking above the red line, a 23-month MA that has captured gold’s secular bull market from the start. This tells us that as long as gold holds above $1800 it’ll remain on a bullish upward path.
The dollar’s rebounding strength is coinciding with a pullback in gold, silver, the miners and in general with energy and resource companies. The rebound in the dollar could last anywhere from a month to 6 months before the dollar reaches a key resistance level at 110, the Sept 2022 downtrend. Dollar strength short term will provide great opportunities to fill up your portfolios with assets at great prices.
My current portfolio allocation is tilted heavily towards cash, liquidity; to take advantage of up & coming opportunities. The other half is in gold, silver, gold and miners as well as uranium and natural gas producers with a smaller (but growing share) in emerging markets like India, Mexico and Indonesia.
Editor's Note: As editor of Gold Newsletter, Brien Lundin covers not only resource stocks, but also the entire world of investing, from small-caps of every type to macroeconomics and geopolitical issues that ultimately affect every investor. This article was published in full in Gold Newsletter on January 25, 2022. You can subscribe for more insights here.
Hard Stuff
Gold Looks Ahead
By Brien Lundin
The markets are anticipating the end of the Fed’s rate-hike crusade, but none so much as gold.
What few recognize, however, is that the Fed is at a crossroads of credibility, and either direction it chooses will be bullish for gold.
All investment markets are predictive mechanisms — crystal balls, if you will, that discount future events by pricing assets today.
But even though every market attempts to anticipate the future, none seem to do it as well as gold. Whether because it’s been a weather vane for worries over thousands of years, or perhaps because today’s high-frequency traders value how the metal responds to monetary signals, gold is perhaps the most predictive of assets.
Remember that gold peaked in 2011 at $1,920, from which point it began a long bear market that only ended in December of 2015. At that top in 2011, it seemed that gold had everything going for it, as the Fed had announced “QE infinity”...monetary expansion at whatever level is needed, for as long as it would be needed.
At the time, we simply couldn’t imagine an easier monetary environment. So why did the gold price start to fall?
Because the market had already begun to look ahead for the end of QE. The Fed’s announcement of unlimited easing meant that the next big news would be an announcement of the end of QE. So the speculators gathered up their chips and exited the gold trade, sending the price lower.
Of course, that’s an example of how gold responds to the expectations of speculative traders. What’s much more consequential is the way it predicts major monetary events.
Note, for example, the big run up in 2020 after the scope of the Covid-19 pandemic became apparent. Gold was rightly looking forward to the Fed’s massive policy response and the inflation it would cause, and the price soared to a new record high of $2,063 by July.
Of course, many disparage gold’s performance subsequently, pointing to how the price pulled back from that peak and failed to respond to the growing inflation pressures in 2022.
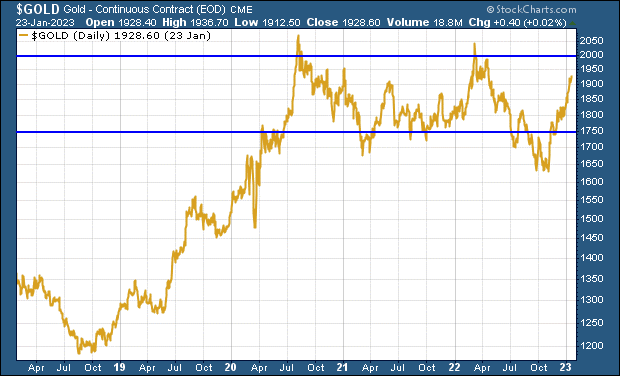
However, as you can see from this chart, gold actually jumped to and maintained a new price plateau — a trading range roughly between $1,750 and $2,000 — and did so well before the inflation pressures started to emerge.
In short, gold didn’t react to the higher inflation numbers because it had already anticipated them.
Now, once again, gold is looking ahead. And what it sees depends upon the success of the Fed’s battle against inflation.
In fact, I believe it’s fair to say that the Fed is facing an historic turning point — a credibility crossroads from which it will be forced into one of two paths. And while both of these paths are bullish for gold, one is much more so.
Before we look ahead with the yellow metal, however, let’s look behind and how we got here.
Setting The Stage
We’ve made a lot of money in this newsletter over the years by playing gold’s seasonal tendencies.
The most important of these has been how the price tends to bottom in mid- to late-December, beginning a rally that often lasts well into the spring. It doesn’t always happen that way, but it does so enough that those who buy when most others are distracted by holiday parties can get an extra 10% or more jump on those rallies.
In fact, sometimes a junior mining stock bought in mid-December can trade for twice or more the price by the end of January.
This year was one of the exceptions to gold’s tendency to bottom in December. But we’re not complaining, because the bottom came early this year, in the first days of November. And that early start meant that the price had gained $230 by the start of 2023...and over $300 as I write.
It’s absolutely amazing how far the price has come already — and equally amazing has been the nearly complete lack of enthusiasm among gold bugs during this rally.
Despite gold rising to within 7% of a new record high, sentiment in the sector is still down in the dumps.
That’s likely because we’ve been bashed over and over again over the years, whenever we’ve gotten our hopes up. Understandably, gold and silver bugs are reluctant to allow those hopes to rise, only to be shattered yet another time.
Some also bemoan how the gold stocks and silver have been unable to outperform gold during this uptrend.
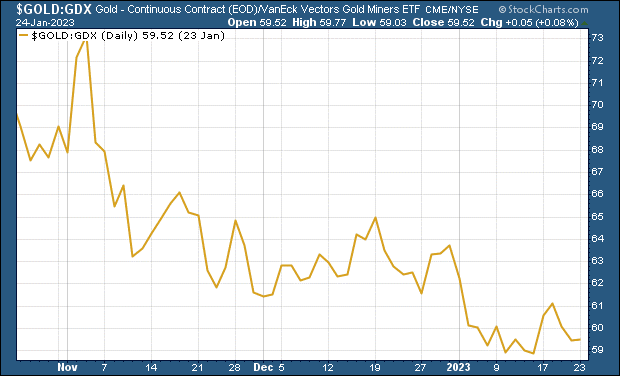
But this is a simplification. As you can see from the accompanying chart, the mining stocks — or at least the large producers as tracked by the GDX — have generally provided significant leverage over the course of gold’s move since early November. The gold/GDX line has fallen steadily, indicating the outperformance of the gold stock index, with only a few blips along the way.
Of course, we tend to play in the junior resource stock sandbox, and we have yet to see the “rising tide lifting all ships” dynamic in this micro-cap sector. Tax-loss selling season and the aforementioned dour sentiment (which is itself a self-fulfilling prophecy) have contributed to keep the juniors in check. But that appears to be changing now.
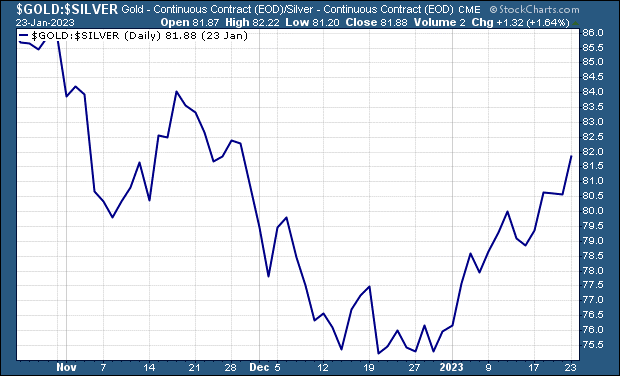
In the case of silver, we have seen some sporadic examples of dramatic leverage by silver, with the price popping here and there, although it’s apparent that gold’s poor sister has not behaved as it should. Our chart of the gold/silver ratio shows that silver had been keeping up as it should, with the ratio falling as silver outperformed, until about mid-December. From then on, however, silver has failed to keep up with gold.
There are some interesting things happening with silver, though, particularly in the structure of the paper silver market. Here we see that the registered component of the Comex warehouse stocks, which are the actual ounces backing up the futures contracts, have dropped over the last two years from 150 million ounces to only about 33 million ounces.
As I noted a few months ago, the tightness in silver and the large-bar demand could combine to create a new-and-improved silver squeeze that actually has a long-term impact on the price. We’ll see.
So, where does this leave us?
It leaves us with a party in the gold market to which virtually no one has yet arrived. The punch bowl is brimming, the music is blaring...but nobody is dancing.
With the price up nearly 20% so far in this run, gold has been in overbought territory over the past couple of weeks. Still, we haven’t seen the kind of significant correction that one might expect, and the price seems (at least as I write) to be working off that overbought condition by holding steady for some time.
Anything can happen, of course, and will in the days ahead...so I won’t try to predict the short-term path. What I want to focus on this issue is the much bigger issue confronting not just gold, and not just the other asset classes, but fiat currencies themselves.
The Crossroads
Fed Chairman Jerome Powell and his compadres at the central bank have been remarkably determined to put the inflation genie back in its bottle.
They know the lesson taught by Paul Volcker in the 1970s: If you don’t kill it off completely, it will raise its ugly head again and again.
I have to confess that I underestimated their resolve. I didn’t expect Powell & Co. to be this diligent. That said, they have yet to confront the three factors that I feel will prevent them from pursuing this tightening policy much longer:
1. The cost of servicing today’s massive federal debt. (The reported annual debt service cost is still showing $736 billion, but is likely near $1 trillion already.)
2. The recession. (Every reliable indicator continues to point toward a full-blown recession. While many pundits say a recession isn’t possible with such a tight labor market, this recession will be characterized not by a lack of jobs, but a lack of employees to fill them.)
3. Something breaking. (This cycle has been notable by the lack of a “Lehman moment,” but the steep pace of rate increases is placing terrible stress on a financial system that had grown dependent upon ultra-low rates. Something could break at any time, and it is likely to come in the bond market.)
One of these factors, and perhaps something I haven’t considered, will force the Fed to halt its rate-hike crusade. Accepting that, if we step back and consider the big picture, there are two possible scenarios ahead:
The Fed stops tightening after having vanquished inflation and gotten it close to the target level of 2%...or the Fed is forced to stop without having pushed inflation to anywhere near its goal.
In the first scenario, the Fed pauses and/or pivots and does a victory lap. With every asset class being driven by central bank policy since 2008, I believe that stocks, bonds, commodities and precious metals all rally in that situation, as all investors need is the promise of easier money to pile back in.
That would be good for us gold bugs, but the second scenario would be even better.
Consider that if the Fed is forced to turn dovish without getting close to 2%, it would be proven powerless to combat inflation. The factors detailed above would remain in place...the debt would continue to prevent higher rates and the markets would remain addicted to easy money.
Moreover, the investing environment would no longer be unequivocally bullish for everything. If inflation remained around 4%-5%, any returns from stocks and bonds would be depreciated at that rate. That might not be an impossible barrier to climb, but it would reduce returns considerably.
In contrast, inflation at those levels, combined with continued easy-money policies, would be tremendously bullish for gold and silver. High inflation, which is simply a high rate of currency depreciation, is precisely what the monetary metals protect against.
So we would see portfolio allocations around the world shift at least slightly toward gold and silver. And considering the trillions invested in global equities and bonds, a very slight shift into the relatively tiny metals markets is all we would need to send prices skyward.
A Last Chance
Another way to look at the current situation is as the last chance for the Fed to maintain credibility in the value of the dollar.
By extension, their battle is for the credibility of all fiat currencies in today’s world.
You see, we’re in the end game of a cycle that extends back to when Paul Volcker killed off the inflationary spiral of the 1970s and early 1980s. From that point onward, central bankers in the U.S. and around the world responded to economic slowdowns or crises with the same policy prescription: easier money.
Initially, this was accomplished by simply lowering interest rates. Yet once the troubled times passed and a central bank would attempt to raise rates to “normal” levels, they were unable to do so without engendering further economic trouble.
Thus, the record shows interest rates proceeding ever-lower, in stair-step fashion, over 40+ years.
However, with the Great Financial Crisis of 2008, interest rates were already near the bottom of a range and lowering them further would not be enough to turn things around. So the Fed, in particular, used its collective imagination to come up with quantitative easing (money printing), along with a number of acronymic emergency rescue programs.
You know the rest: The Fed was barely able to raise rates off of bedrock before Covid-19 came, and then all the nearly unimaginable efforts of 2008 had to be doubled and redoubled.
Markets had become addicted not to easy money, but ever-easier money, so the dosage of monetary adrenaline had to be much stronger to get the same effect.
The issue now is that once the next crisis hits, the Fed will have to completely absolutely blow the dam to get anything near the same response.
Thus, we have reached the crossroads: If Powell & Co. are unable to stop inflation in its tracks, it will become self-evident to all market actors that inflation — the rapid depreciation of fiat currency purchasing power — can no longer be stopped.
This is the crisis of confidence, of credibility in fiat money, that the Fed and all central banks will face. I really don’t know if we’ll reach this point in this cycle, or the next boom-bust go-around, or the one after that.
But I have a feeling that, as quickly as things move these days, that day of reckoning could be near. In short, if the Fed doesn’t deliver the coup de grace to inflation now, it may never be able to.
And I think the Fed realizes this as well.
Where We Are Now
Although many gold bugs are hesitant to admit it, we’re in a bull market.
That’s apparently not only by the near-20% gain we’ve posted since the lows of last fall, but also by the character of this gold market. For instance, gold seems to be finding reasons to rise, rather than excuses to fall. Longtime readers of this newsletter know that I view this as a hallmark of a bull market.
There’s an endless stream of new data and intelligence coming over the bow every day, and Mr. Market looks at each nugget of news to see whether it’s bullish or bearish for each asset class or individual investment.
When just about every new datum is interpreted as bullish, even those that would seem to be bearish at first glance, then that’s a bull market.
The reverse is also true, but thankfully we’re not in that situation. We are, in fact, in precisely the opposite condition. Notably, gold has shown signs in recent weeks of decoupling from the broader equity markets and other asset classes.
As I noted above, central bank monetary largesse, or the lack thereof, has been the driving dynamic for all assets since 2008. The once non-correlated asset classes, such as stocks vs bonds, have instead become locked together like Siamese twins, moving up and down in unison according to the ebbs and flows of monetary policy.
Gold, silver and other commodities were gathered in as well, as all correlations moved toward “1,” the mark of perfectly positive correlation, across every market.
That started to change for gold, however, last month.
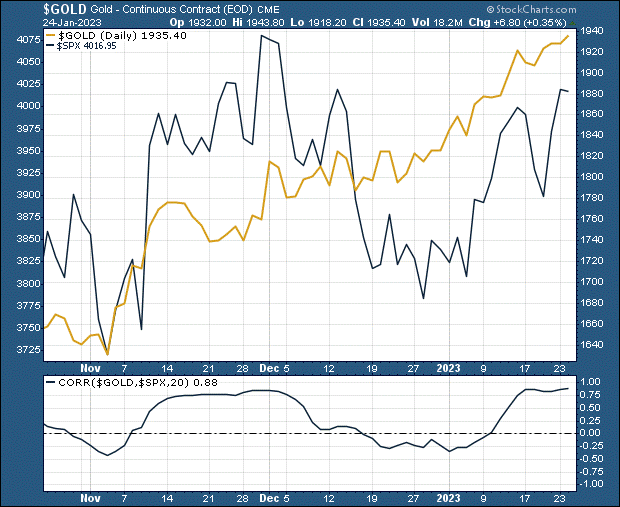
As you can see from the chart above, as gold began to rise in November, the U.S. stock market (as represented here by the S&P 500) bounced all over the place. The rolling 20-day correlation between the two fell from near 1 to below zero, showing an actual inverse correlation.
Now, if we rolled that chart back a year or two, we’d see some other instances of that correlation falling below zero for a brief period of time. But in those instances, the inverse correlation was the result of gold falling while stocks rose. This time gold is finding reasons to rise when the stock market is failing to do so.
In short, it’s a bull market.
This bodes well for the scenario I suggested above, wherein the Fed is forced to pause or pivot with inflation remaining stubbornly high. Having proven that it can decouple from stocks and other assets, and in a good way, it seems ready to do so again.
Meanwhile, the Fed is drawing closer to the end of its rate hikes, and appears set to slow down the pace to a mere quarter-point at the conclusion of its next meeting on February 1st.
That’s the expectation, at least, and we’ve seen investors plow back into the markets in anticipation. Thus, the correlation between stocks and gold has, as you can see, crept back into the positive zone.
Another key factor during gold’s rally has been the coincident decline in the Dollar Index.
Many credit gold’s move higher to the move lower in the dollar, but my view has been that this isn’t so much a cause-and-effect situation as it is both being driven in opposite directions by Fed policy. When the Fed was seemingly hiking with no end, the dollar was gaining against its trade-currency brethren (where central banks were behind the Fed).
Now, as it appears the Fed’s tightening campaign is nearing an end, and doing so in advance of other central banks, the dollar is understandably dropping. But gold is rising not because of the dollar’s decline, but because of that same Fed creep toward more-dovish policy.
In other words, the clearance sale is ending.
Editor's Note: Per Bylund, PhD, is a Senior Fellow of the Mises Institute and Associate Professor of Entrepreneurship and Johnny D. Pope Chair in the School of Entrepreneurship in the Spears School of Business at Oklahoma State University, and an Associate Fellow of the Ratio Institute in Stockholm.
The Inside Story
7 Myths About the Austrian School of Economics
By Per Bylund
It’s become increasingly clear that the usual mainstream economics isn’t working. The supposed experts at the Federal Reserve say they were surprised by inflation. Nearly all mainstream economists in 2020 were unanimous in agreeing that inflating the money supply by trillions of dollars in a few months would have no serious ongoing problems. And, as inflation began to rise, these economists were still insisting that inflation was really no problem.
These economists have all failed both in their predictions and in their plans for how to make the economy stronger. This is part of a larger problem. These economists subscribe to flawed and inaccurate economic theories that get economics wrong on everything ranging from business cycles right on down to everyday decisions about what to buy at the grocery store.
At times like these, we often see increased interest in finding non-mainstream schools of thought that better explain economics. Among these schools is the Austrian School of Economics. The Austrian School provides a different and more accurate view of the economy and how we participate in it.
Yet, those who disagree with the Austrian School continue to put forward many incorrect misconceptions about the Austrian School. Often, most of what people “know” about the Austrian school is actually just the myths. Perhaps you have already heard some of them.
So, as a way of introducing the Austrian School, let’s first address some of these myths and misconceptions, and in doing so gain a better understanding of the Austrian School overall.
Myth 1: "Austrian economics is not empirical."
False.
Empirical studies ("history") are important in Austrian economics and have larger scope than in mainstream economics. Mises worked with applied research in the Vienna Chamber of Commerce and founded the Austrian Institute for Business Cycle Research, for which he appointed Hayek as the first director. This is where Hayek did much of the business cycle research that later won him the Nobel Prize.
What critics fail to understand is Austrians' narrower definition of theory, which is not a collection of hypotheses but true, general statements. Austrian economic *theory* cannot be developed using incomplete and imprecise measurements of observations. But this does not mean Austrians cannot or will not do empirical research.
Myth 2: "Austrian economic theory is not related to the real world."
False.
Austrians, following its founder Ludwig von Mises, derive true statements from the nature of human action: that it is purposeful behavior, i.e., actors aim to achieve something they consider both attainable and valuable using the means they recognize as appropriate and effective. Action always takes place in the real world and it is through our real-world experience that we recognize that the nature of action is in fact true. What is logically derived from a true statement about action cannot magically lose its empirical relevance just because it is derived logically rather than "letting the data speak."
Austrians hold the typical view of economists since at least Adam Smith: that theory cannot be derived from observations. Austrian theory, as traditional/classical economic theory, is more like math than empirical physics. Math produces true a priori statements that we use to understand what we observe. That we can calculate partial derivatives but not observe them does not make them less true in/about the real world. It is the same with Austrian economics.
Myth 3: "Austrian economic theory cannot explain phenomena in the real world."
False.
Similar to the previous misconception, this statement evaluates Austrian theory using a different definition of theory. Mainstream economics claims to explain more, even specific cases, by adopting a looser and thereby broader definition of theory, which only makes it less reliable.
Simply put, mainstream economics cannot make a claim of truth. Austrian economics can, because its theory solely derives from a true axiom (action as purposeful behavior)—nothing beyond what can be derived logically enjoys the status of theory. Austrians make the stronger claim but stick within narrower boundaries of theory. This does not make the theory unrelated to the real world, but only more reliable. Just like, e.g., engineers can use true math to make reliable calculations about real-world projects, Austrians use true economic theory as a framework to uncover the real goings-on in the real economy.
Myth 4: "Austrian economics cannot explain why people act."
False.
The action axiom states exactly why people act: they aim to attain something they personally value, seeking to change their present situation for one anticipated to be better. But it is true that Austrians do not attempt to explain the mental processes that make a person value one thing over another. That's not the role of the economist, however.
Being logicians, Austrians use very stringent and clear definitions and distinctions. They clearly distinguish between the realms of economics and psychology, the former being the study of action and its effects and the latter the study of the motivations for behavior. Similarly, within economics, Austrians distinguish between theory, which is a priori and true, and history, which is the study of empirical data through the lens of theory. It is unfortunate that other schools of thought are comparatively sloppy in their definitions and distinctions, which makes them much less reliable, less scholarly, and, so, less scientific.
Myth 5: "There is no way of telling if Austrian economic theory is accurate."
False.
If this were the case, then there would also be no way of telling if statements of logic, math, geometry, etc. are true. That's clearly not the case. The statement makes the error of assuming economic theory is inductive and empirical, which is not true for the Austrian school (see above)—and wasn't true of economics until well into the twentieth century. Economics was (and properly is) a deductive science.
Myth 6: "Austrian economics is an idiosyncratic take on economics."
False.
Austrian economics continues the economic reasoning tradition from classical economics but adds the marginalist analysis and value subjectivity of Carl Menger. It is modern economics that breaks with the discipline's roots in deductive social theorizing by its physics envy, mathematizing, straying into the realm of psychology, and aiming for efficient social engineering through policy rather than for understanding the market economy.
Myth: 7 "Austrian economics is ideological."
False.
Austrian economic theory actually has much less room for ideology than other schools of thought. In fact, this makes Austrian economics much less ideological than the schools of economic thought that rely on empirical analysis for theorizing. This is true because such analysis necessarily includes a large degree of interpretation (so the theorist's personal view can easily, and often does, enter). What this critique means is that the critic has an ideological or emotional resentment of free markets, typically asserting that "markets don't work."
Austrians don't make such normative statements, but only explain (by uncovering) how markets work. The value judgment of what is better is not part of theory, but Austrians can expertly point out whether a means is appropriate for the stated end. Also, Austrians properly theorize on the free market first (that is, unhampered interaction) to then uncover the impact of specific influences (regulations, changes in preferences, etc.). You cannot understand how an influence changes things unless you first understand how the economy works without it.
It would take much more time to explain the details of what the Austrian School has to say about business cycles and entrepreneurship—to name just two topics—but by busting some of these myths about Austrian Economics my hope is that some readers will be inspired to investigate on their own. The website of the Mises Institute is an excellent place to start.
|