
Gold's record-breaking rally is still going strong, fueled by central bank gold buying, safe haven...
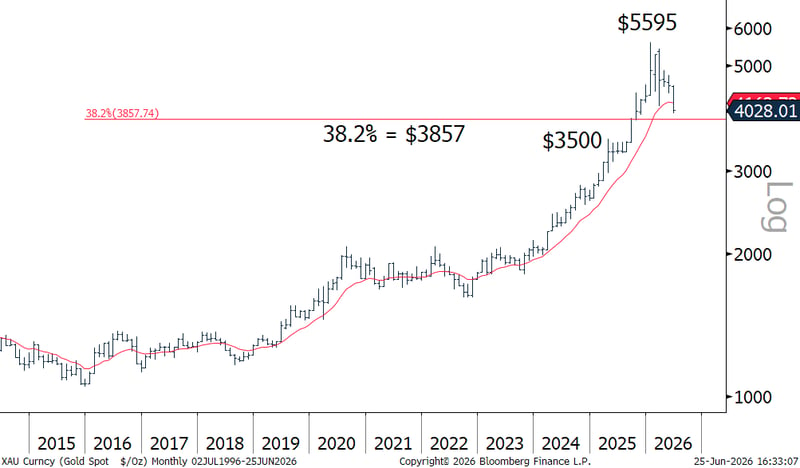
Gold has already delivered one of the most volatile starts to a year on record, surging above $5,500 an ounce in January before falling below $4,000 in late June. Even after that sharp reversal, gold is still among the top-performing assets over the past year.
Yes, even despite the pullback.
On a technical basis, gold is still trending well above its two-year average. Gold is still showing significant gains year-over-year, down just 7% in the first half of 2026 after rallying 64% last year. Last July, gold spot prices were in the $3,320-$3,360 range, compared to roughly $4,000 today.
And there's a strong possibility gold recovers the 7% loss and even gains momentum this year.
Some investors use technical indicators like moving averages to measure relative strength and positioning. As a matter of fact, recent data indicates that gold may be approaching its next technical support level (see chart above).
Since 1971, there have been only eight instances in which gold has dropped by more than 20% after reaching a record high, typically averaging a 29-36% loss. At present, the gold price is about 25% below its record high. In these instances, organic demand from investors or central banks has historically boosted gold after these more sizable pullbacks. Meaning that if gold goes below a certain technical support level (+-10%), it will likely trigger bargain hunting demand and drive prices right back up.
If this isn't the bottom of this downward trend, then it's very close to it.
And the market is set up for a possible breakout. However, gold remains highly reactive to risk, uncertainty, and changes in rate expectations.
For long-term investors, this creates an important decision point. If gold stays rangebound for a while longer, pullbacks may offer a chance to average in at a good value.
Last week, gold settled Thursday at its lowest level in 9 months when oil prices rose. The worsening conflict between the U.S. and Iran continues to stoke fears of prolonged inflation and future interest rate hikes. Investors surveyed were split on betting on a rate hike in September as the Fed signaled growing support for a rate hike before year's end to rein in inflation toward the central bank’s 2% target.
However, the second half of 2026 could still bring renewed upside, especially if economic growth weakens, geopolitical pressures intensify, or investors step back in on price dips. Gold may be stuck rangebound for now, but today's volatility in precious metals may yet yield rewards for proactive investors willing to look past current negative market sentiment.
Does that sound like you? If so, check out our current gold bullion offer below and call your ASI Preferred Client Representative today.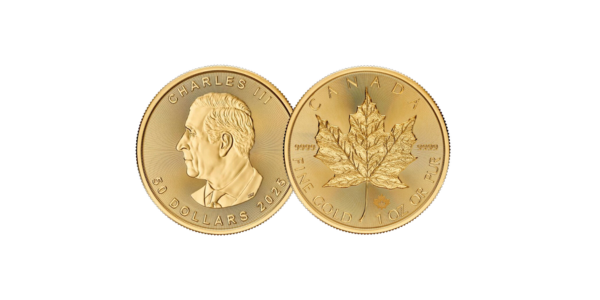
1 oz. Gold Canadian Maple Leaf Coins
Just $129 over spot!
Whether your focus is inflation protection, portfolio diversification, or long-term financial resilience, we can provide actionable insights to help you move forward with confidence. Call 1-800-831-0007 or email infoasi@assetstrategies.com to add 1 oz. Gold Maples to your portfolio today.
*Prices subject to change based on market fluctuation and product availability. Prices reflected are for cash, check, or bank wire. Minimum order is 1 oz. of gold. Orders of 10 oz. or more include free shipping, handling, and insurance. Year of issue is random and based on availability. Offer expires Friday, July 24, 2026, or while supplies last.